
2016
3(47)
DOI: 10.5277/arc160307
Marzena H. Heliak*
Analizy systemów transportowych z zastosowaniem
modelu pośrednich możliwości i predykcyjnych metod badawczych
w procesie dydaktycznym – wybrane problemy
Analyses of transport systems applying the intervening
opportunities model and predictive research methods
in the process of teaching – selected issues
Wprowadzenie
Podejście modelowe do badań miejskich struktur
osadniczych na kierunku gospodarka przestrzenna na
Wydziale Architektury Politechniki Wrocławskiej wystę-
puje w procesie dydaktycznym od ponad 20 lat. Jednak
realizowane tam badania nad miejską strukturą osadniczą
w zakresie transportu sięgają lat 60. XX w. W różnych
projektach podjęto wówczas temat obciążenia sieci dro-
gowej stanu istniejącego i prognostycznego, w przedzia-
łach czasowych na 20–30 lat, dla większych miast Polski,
w tym dla Wrocławia, Krakowskiego Zespołu Miejskiego,
Poznania, Górnośląskiego Okręgu Przemysłowego oraz
dla Podtatrza po stronie polskiej i słowackiej, Wałbrzy-
cha czy dawnego województwa nowosądeckiego i Trój -
miasta.
Wydział Architektury i Katedra Planowania Prze-
strzennego do dziś aktywnie uczestniczy i współpracuje
z ośrodkami miejskimi, analizując struktury przestrzenne
z wykorzystaniem modelowego podejścia do systemów
transportowych w rozwoju regionalnym czy lokalnym
[1]. Z tradycji tego Wydziału wynikają działania nauko -
we, które mają również zastosowanie aplikacyjne w za-
rządzaniu czy projektowaniu struktur systemu osadnicze-
go w różnej skali (miasta, konurbacji, regionu, kraju).
Introduction
The model approach to research of urban settlement
structures in the eld of spatial management at the Faculty
of Architecture at the Wrocław University of Science and
Technology has been present in the teaching process for
over 20 years. However, the research conducted there on
the urban settlement structure in the scope of transporta-
tion goes back to the 1960s when the load of the existing
as well as future road networks was the subject of vari-
ous projects undertaken every 20–30 years for the major
Polish cities, including Wrocław, Kraków City Complex,
Poznań, Upper Silesia Industrial Area and for the Tatra
Mountains Foothills on the Polish and Slovakian sides,
Wałbrzych or former Nowy Sącz Province and Tricity.
The Faculty of Architecture and the Chair of Spatial
Planning have been actively participating and cooperating
with various cities, analyzing the settlement structures with
the use of the model approach to the transportation systems
in the regional or local development [1]. The Faculty has
in its tradition research activities which are also applied
in managing and designing the settlement system struc-
tures of various scale (city, conurbation, region, country).
The paper regards the selected aspects of application of
the intervening opportunities model
1
in both the existing
1
The intervening opportunities model: […] is a model approach to
spatially present the distribution of contacts. Its idea put forward by
* Wydział Architektury Politechniki Wrocławskiej/Faculty of Ar-
chi tecture, Wrocław University of Science and Technology.

86 Marzena H. Heliak
W artykule poruszono wybrane wątki dotyczące za-
stosowań modelu pośrednich możliwości
1
zarówno w ist-
niejących strukturach osadniczych, jak i w założeniach
sieci idealnych [3], realizowane w trakcie zajęć dydak-
tycznych w Katedrze Planowania Przestrzennego. Zasób
badawczy dotyczący wybranych zastosowań modelu po-
średnich możliwości w osadnictwie jest bogaty i nie spo-
sób w pełni zaprezentować wszystkich zagadnień, dlatego
wybrano istotniejsze elementy.
W trakcie czteroletniego cyklu realizacji jednoseme-
stralnego przedmiotu „Techniki analiz i prognoz transpor-
towych” zostały przeanalizowane wybrane problemy do-
tyczące zastosowań modelu pośrednich możliwości oraz
została wprowadzona do badań sieci transportowych jedna
z metod – Tadeusza Zipsera – dotycząca pomiaru ruchu
obciążeń komunikacji [1], [4], [5], omówiona w kolejnych
partiach artykułu. Równoległym celem zajęć było zwery-
kowanie tej metody pod kątem sposobu oceny obciążeń
ruchu na wybranych odcinkach układu komunikacyjnego
miasta. Badania ukierunkowane zostały na sprawdzenie
różnych sposobów obserwacji. Porównywano wyniki po-
miarów obciążeń ruchem kołowym wybranych odcinków
drogowych według metody Tadeusza Zipsera z rezulta -
tami Kompleksowych Badań Ruchu (KBR) dla Wrocławia
prowadzonych w 2010 i 2011 r. [6]. Nowatorskim podejś -
ciem w metodzie Tadeusza Zipsera jest badanie tzw. meto-
dą „dyna miczną”
2
, która polega na aktywnym udziale w ru-
chu. Badanie było prowadzone trzykrotnie. Do pierwszego
wytypowano kilka odcinków w strukturze Wrocławia oraz
wskazano punkty do obserwacji statycznej na tych samych
odcinkach. W drugim badano i porównywano z badaniem
KBR wybrany odcinek C10 według KBR oraz wskazano
punkty do obserwacji statycznej na tym samym odcinku.
W trzecim przypadku badanie zostało przeprowadzone
w ścisłym centrum Wrocławia oraz wykorzystano tramwaj
jako środek obserwacji transportu.
W dalszej części niniejszej pracy, dotyczącej mo-
delowań, zostały zaprezentowane wybrane przykłady
tematów i problemów realizowanych w trakcie zajęć
dy daktycznych z przedmiotu wybieralnego „Techniki
analiz i prognoz transportowych” w latach 2014/2015
oraz 2015/2016.
Problematyka dotycząca modelu pośrednich
możliwości, realizowana podczas zajęć
– wybrane wątki
Tematyka zajęć dydaktycznych została tak ukierun-
kowana, aby studenci mogli z jednej strony poznać
teore tyczne założenia modelu pośrednich możliwości
1
Model pośrednich możliwości (the intervening opportunities mo -
del): […]
jest podejściem modelowym do odwzorowania prze strzennego
rozkładu kontaktów. Idea jego, podana przez S. Stouffera, za kłada, że kon
takty rozchodzą się w przestrzeni, szukając swego za spokojenia, tak długo,
lub raczej tak dalece, dopóki nie osiągną odpo wiedniego celu [2, s. 23].
2
Metoda „dynamiczna” polega na aktywnym udziale w ruchu sa mo-
chodowym (także innym środkiem lokomocji) osoby badającej, zli czają cej
jadące z naprzeciwka pojazdy. W opracowaniach: [1], [4] moż na zapo-
znać się szerzej ze sposobem badań i założeniami tej me tody. W opraco-
wa niach tych opisano wariant dla badacza poru sza ją cego się tramwajem.
settlement structures and in the ideal network designs [3]
during the classes at the Chair of Spatial Planning. The
research resources regarding the selected applications of
the intervening opportunities model in a settlement are
rich and it is impossible to fully present all of its aspects
and that is why the most important elements have been
selected.
The selected issues regarding the application of the
intervening opportunities model were analyzed during
the one-semester-long subject taught for four years the
“Techniques of Transportation Analyses and Forecasts”
and one of Tadeusz Zipser’s methods regarding trafc
load measurements, which is described further in the
article, was introduced to the research on transportation
networks [1], [4], [5]. A parallel objective of the classes
was to verify this method in respect of the way how the
trafc load is evaluated in the selected sections of the city
trafc circulation system. The research was directed to
verify various ways of observation. The measurement re-
sults of the vehicle trafc loads on the selected road sec-
tions were compared in compliance with Tadeusz Zipser’s
method to the results of the Comprehensive Trafc Study
(CTS) for Wrocław conducted in 2010 and 2011 [6]. The
innovative approach in Tadeusz Zipser’s method is the
study with the use of the so-called “dynamic” method
2
which involves active participation in trafc. The study
was conducted three times. Several sections were se-
lected for the rst study in the structure of Wrocław and
the points of static observation were indicated on the
same sections. In the second study the selected section
C10 was studied and compared to CTS and the points
of static observation were indicated on the same sections.
In the third case the study was conducted in the very cen-
ter of Wrocław and a tram was used as an observation
vehicle.
Further sections of this paper regarding modeling
present the selected examples of topics and issues un-
dertaken during the classes in the facultative subject the
“Techniques of Transportation Analysis and Forecasts” in
2014/2015 and 2015/2016.
The issues regarding the intervening opportunities
model undertaken during the classes
– selected issues
The topics of the classes were selected for the students
to be able to learn the theoretical assumptions of the inter-
vening opportunities model used in transportation analy-
ses on the one hand and to perform analyses on their own
or in a few-person-teams with the use of that model both
S. Stouffer assumes that contacts spread in space searching for their
sa tis faction as long or rather as far as they reach the adequate desti-
nations [2, p. 23].
2
The “dynamic” method involves active participation in vehicle
traffic (including other means of transportation) on the part of the re -
searcher, counting the vehicles coming from the opposite direction.
Stu dies: [1], [4] present a more detailed description of how the study
was conducted and the assumptions of that method. They describe the
va riant for the researcher riding a tram.

Analizy systemów transportowych/Analyses of transport systems 87
in the existing transportation structures and in the system
of the chain and triangle structure of ideal cities on the
other hand [3].
One of the rst aspects undertaken during the classes
was modeling the concentration of sources (i.e. places of
residence) and destinations (i.e. workplaces or commerce)
and comparing them with already existing ones. The inter-
vening opportunities model was used as maximizing the
contact intent and ease.
The networks of ideal cities which alluded to the as-
sumptions of the chain and triangle network by Tadeusz
Zipser were analyzed in the following semester. The loads
in such networks were modeled. The intervening oppor-
tunities model served to provide the most probable trips
matrix in the assumed city networks.
In the following semester, the research with the use of
the intervening opportunities model regarded the distribu-
tion of sources and destinations in the existing cities. The
selected issues regarding the use of the model in question
in analyzing the current needs of the development of the
city function and space or transportation structure were
presented mainly on the basis of the cities, such as Łódź,
Opole, and Wałbrzych.
Łódź – case description
The example of Łódź is very interesting due to the sub-
ject of the study undertaken with the use of the intervening
opportunities model. Over one semester, a group of the
spa tial management students at the Faculty of Architec-
ture at the Wrocław University of Science and Technology
con ducted studies of the transportation network in Łódź
both with the use of the intervening opportunities model
and eld studies which are described in more detail below.
The analyses conducted on the existing network in
Łódź with the use of the intervening opportunities model
were assumed to present the signicant inuence of in-
dividual junctions, sections further referred to as nodes,
on the network layout and to determine their importance
(rank) in the city transportation network structure.
The vehicle trafc load and the home-work contact
were modeled on the existing network, and the variant
approach as well as the vehicle trafc loads distribution
were studied in the whole existing network. The load of
the network in Łódź after excluding major nodes (junc-
tions) in the city center and in its different parts were ana-
lyzed with certain assumptions regarding the operation
of the transportation network itself. The exclusion of the
nodes modeled the network load, ignoring for instance
the junctions or the sections in the existing transportation
system which were out of use due to their renovation. The
variant approach was assumed with the exclusions of one
node from the network and at the same time several ones
in its close proximity from 2 to 3 sections (junctions).
The distribution of loads in the whole network and the
role of the excluded nodes (junctions) for that network
were analyzed. The studies provided interesting ndings
in respect of the rank and importance of the nodes (junc-
tions) and their inuence on the whole city transportation
system.
wy korzystywanego do analiz transportowych, a z dru-
giej – samodzielnie lub w kilkuosobowych zespołach
wy konywać analizy z wykorzystaniem tego modelu za-
równo w istniejących strukturach komunikacyjnych, jak
i w syste mie struktury łańcuchowo-trójkątowej miast
ideal nych [3].
Jednym z pierwszych aspektów podjętych w trakcie
zajęć było modelowanie koncentracji źródeł (tj. miejsc
zamieszkania) i celów (tj. miejsc pracy lub handlu) oraz
zestawienie ich z istniejącymi. Wykorzystano model po-
średnich możliwości jako maksymalizujący zamiar i łat-
wość kontaktu.
W kolejnym semestrze analizowano sieci miast ideal-
nych, które nawiązywały do założeń sieci łańcuchowo-
-trójkątowej według Tadeusza Zipsera. Zrealizowano
mo delowania obciążeń w takich sieciach. Model pośred-
nich możliwości służył do uzyskania najbardziej praw-
dopodobnej więźby ruchu w zakładanych sieciach miast.
W kolejnych semestrach badanie z zastosowaniem mo-
delu pośrednich możliwości dotyczyło rozkładu źródeł
i celów w miastach istniejących. Głównie na przykładach
Łodzi, Opola i Wałbrzycha zostały przedstawione wybra-
ne problemy dotyczące zastosowań omawianego modelu
do analiz obecnych potrzeb rozwoju struktury funkcjonal-
no-przestrzennej czy komunikacyjnej miast.
Łódź – opis przykładu
Przykład Łodzi jest bardzo interesujący ze względu
na tematykę podjętego badania z zastosowaniem mode-
lu pośrednich możliwości. Grupa studentów gospodarki
przestrzennej na Wydziale Architektury Politechniki Wro-
cławskiej w trakcie jednego semestru zajęć realizowała
zarówno badania nad siecią komunikacyjną Łodzi z zasto-
sowaniem modelu pośrednich możliwości, jak i badania
terenowe, o których szerzej poniżej.
Podjęte analizy na istniejącej sieci Łodzi z wykorzy-
staniem modelu pośrednich możliwości w swoich zało-
żeniach miały uchwycić istotny wpływ poszczególnych
skrzyżowań, odcinków dalej określanych jako węzły, na
układ sieci oraz wyznaczyć ich ważność (rangę) w struk-
turze sieci komunikacyjnej miasta.
Na istniejącej sieci modelowano obciążenie ruchem
kołowym, kontakt dom–praca oraz badano wariantowe
podejście i sposób rozłożenia obciążeń ruchem kołowym
w całości sieci istniejącej. Przy pewnych założeniach co
do funkcjonowania samej sieci układu komunikacyjnego
analizowano m.in. obciążenie sieci Łodzi po wyłączeniu
ważnych węzłów (skrzyżowań) w centrum miasta oraz
w różnych jego częściach. Wyłączenie węzłów mode-
lowało obciążenie sieci z pominięciem np. nieczynnego
z powodu remontu skrzyżowania lub odcinka w istnie-
jącym systemie komunikacyjnym. Założono wariantowe
podejście z wyłączeniami jednego węzła w sieci oraz
kilku jednocześnie w bliskim jego sąsiedztwie od 2 do
3 odcinków (skrzyżowań). Analizowano rozkład obciążeń
w całej sieci i rolę wyłączonych węzłów (skrzyżowań) dla
tej sieci. Badania przyniosły interesujące obserwacje co
do wagi i znaczenia węzłów (skrzyżowań) i ich wpływu
na całość układu komunikacyjnego miasta.

88 Marzena H. Heliak
Autorem implementacji i operatorem algorytmów był
Maciej Kamiński
3
. Programy obejmują swym zakresem
przede wszystkim liczne warianty modelu pośrednich
możliwości, ale także funkcje obliczenia obciążenia
odcinków drogowych. Skrypty były wykonane w języ-
ku Python, jako źródło danych posłużyła baza danych
MongoDB. Algorytmy te są dostępne na licencji otwartej
i zawierają w sobie bogaty dorobek naukowy Katedry Pla-
nowania Przestrzennego.
Pierwszym krokiem po przygotowaniu danych wej-
ściowych było wykorzystanie modelu pośrednich moż-
liwości do stworzenia macierzy wymiany ruchu o relacji
kontaktu dom–praca. Uzyskane w ten sposób wielkości
ruchu pozostały niezmienione w trakcie całego badania.
Krokiem drugim było rozłożenie uzyskanych wielkości
ruchów na rzeczywistą sieć drogową i przypisanie liczby
samochodów pokonujących każdy z jej odcinków. Kro-
kiem trzecim było wyłączenie z ruchu jednego z węzłów
lub grupy węzłów, wymuszając tym samym zmianę ścież-
ki ruchów dotychczas odbywających się za ich pomocą.
Etap ten wykonywano 7 razy, za każdym razem wyłącza-
jąc inne skrzyżowanie lub grupę (2 do 3 jednocześnie).
W celu lepszego odwzorowania rzeczywistości w mo-
delowaniu wzięto pod uwagę gminy ościenne, tzw. koł-
nierz. Danymi wejściowymi do modelu były liczba
mieszkańców oraz liczba miejsc pracy w mieście i oko-
licy. Podział na rejony został przeprowadzony tak, aby
możliwie najlepiej odzwierciedlić stan rzeczywisty co do
źródeł (miejsc zamieszkania) ludności miejskiej i okoli-
cy. Natomiast podział na rejony gmin okalających miasto
w tzw. w kołnierzu został przedstawiony za pomocą gra-
nic administracyjnych gmin przyległych. Liczba celów
wyrażona była przez liczbę pracujących za pomocą szaco-
wania danych z Banku Danych Lokalnych. Selektywność,
jaką przyjęto do modelowań, wynosiła λ = 0,00002652
4
.
Obszar badania obejmował podział na 337 rejonów.
Analizy przeprowadzono w kilku zespołach. Każdy
z tych zespołów określał zmiany ilościowe i jakościowe
w kilku wariantach wyłączania węzłów (skrzyżowań).
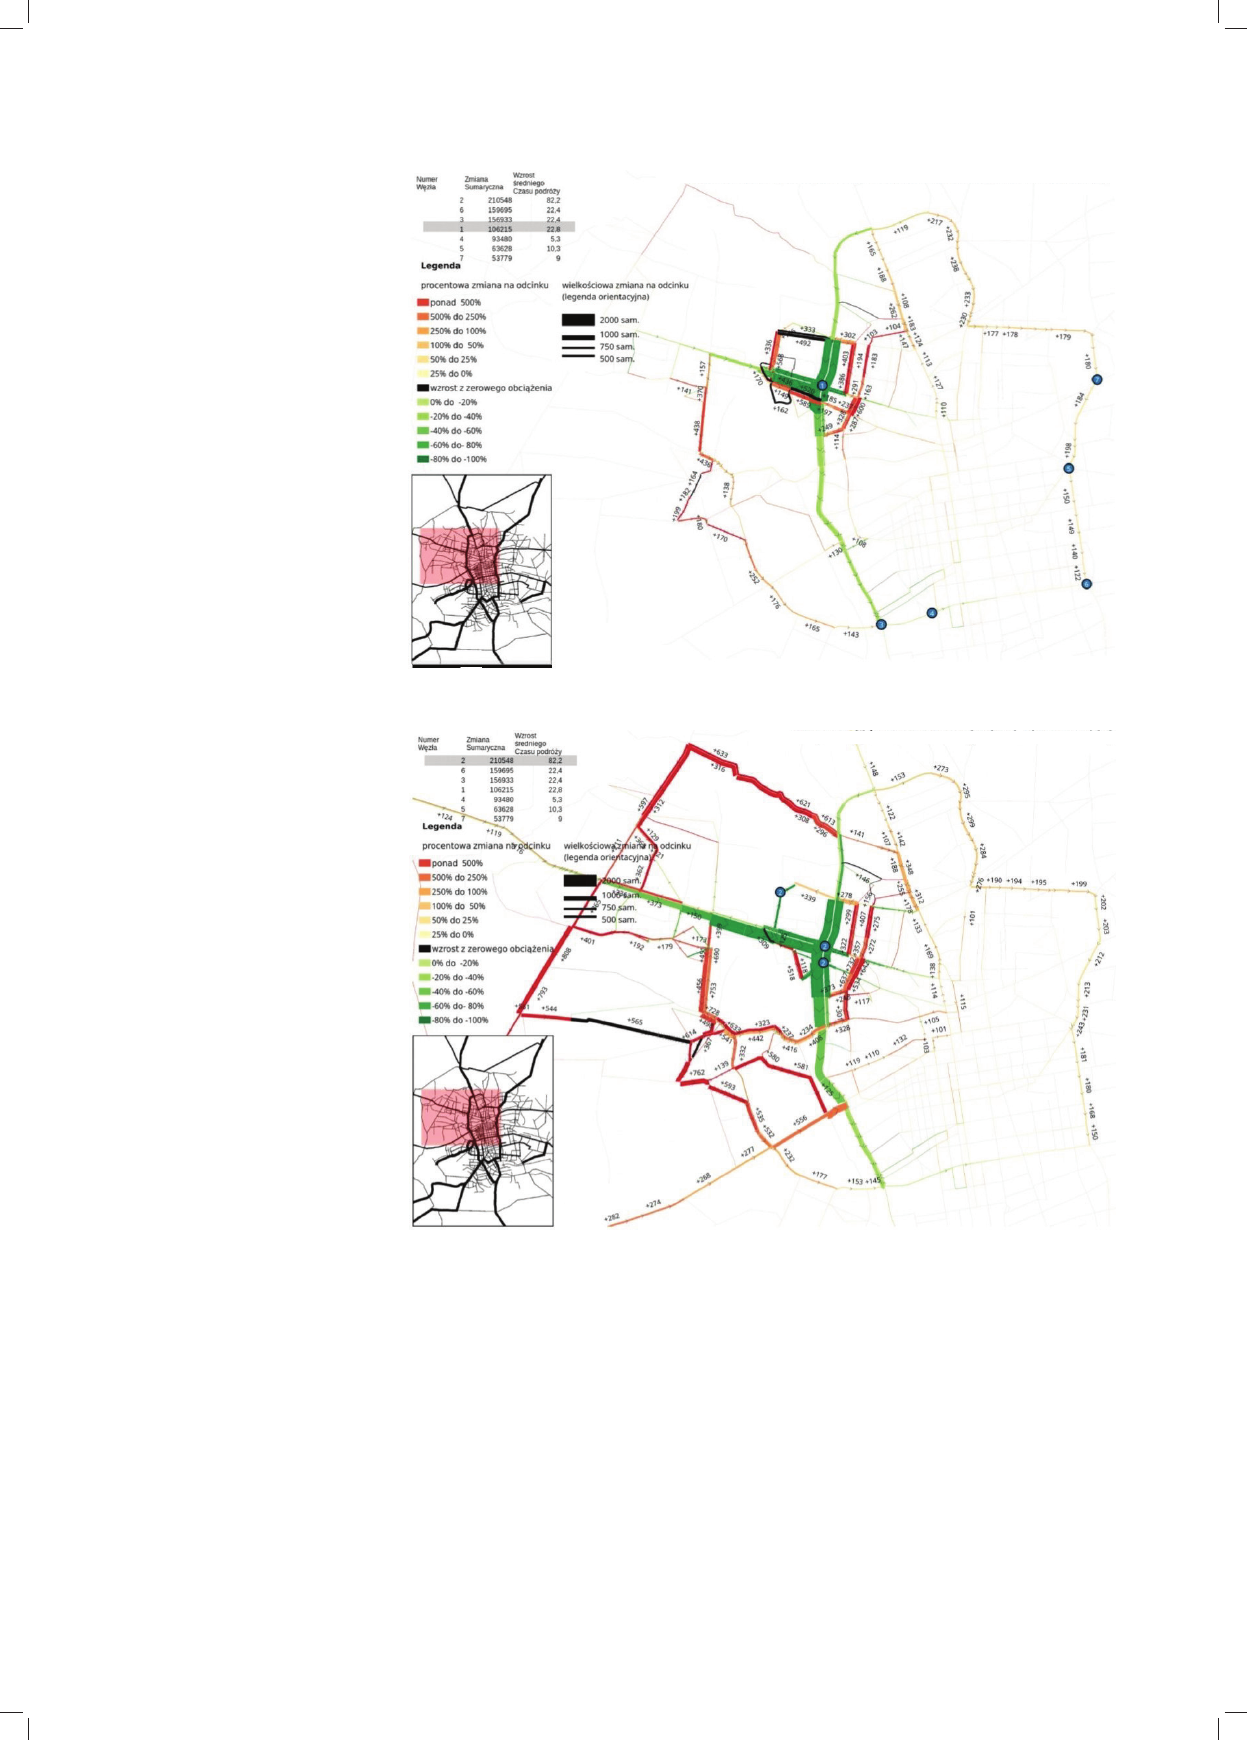
Poniżej zaprezentowano przykłady wykonane na sieci
Łodzi. Na ilustracji 1 pokazano wyłączenie jednego od-
cinka w sieci oraz ilościowe i procentowe zmiany w sieci.
Na ilustracji 2 przedstawiono wariantowe podejście
z wyłączeniem kilku (1 lub 2–3) skrzyżowań jednocze-
śnie. Na tym etapie analizy prowadziły do wstępnej oceny
wrażliwości sieci komunikacyjnej Łodzi oraz ważności
poszczególnych węzłów (skrzyżowań) na powodowanie
zmian w obrazie obciążeń w całej sieci układu komunika-
cyjnego miasta. Każdy z zespołów dokonał oceny zmian
ilościowych i procentowych w układzie komunikacyjnym
miasta dla innego węzła lub grupy węzłów.
Do dalszych badań i możliwości zastosowań aplika-
cyjnych wariantowych wyników przydatne są wskaźni-
ki liczbowe oceniające wpływ wyłączenia węzła na całą
sieć. Zmiany jakościowe rozumiane jako zmiana śred-
3
Pracownik Katedry Planowania Przestrzennego Wydziału Archi-
tektury Politechniki Wrocławskiej.
4
λ – prawdopodobieństwo potencjalnego zaakceptowania celu
kon taktów przy założeniach minimum m.in. czasu, kosztu, wysiłku.
The algorithms were implemented and operated by
Maciej Kamiński
3
. The scopes of programs include pri-
marily numerous variants of the intervening opportuni-
ties model as well as the road section load calculation
functions. The scripts were developed in the Python
language and MongoDB served as the data source.
These are open source algorithms and they testify to
the great academic achievements of the Chair of Spatial
Planning.
The rst step in the development of input data was
to use the intervening opportunities model to create the
home–work contact trafc exchange matrix. The trafc
values generated this way remained unchanged during the
whole study. The second step was to distribute those val-
ues over the actual road network and to assign the number
of cars traveling over each of its sections. The third step
was to exclude one of the nodes or a group of nodes from
the trafc, forcing this way a change in the current trafc
paths. This stage was conducted 7 times, each time exclud-
ing a different junction or a group (2 to 3 at the same time).
In order to better present the reality of the neighboring
communes, so called the collar, was taken into account
in modeling. The model input data included the number
of inhabitants and the number of workplaces in the city
and around it. The area was divided into regions so as
to reect the reality best in respect of sources (places of
residence) of the inhabitants of the city and its surround-
ings, whereas the division of the communes around the
city (collar) into regions was presented with the use of
the administrative borders of the adjacent communes. The
number of destinations was demonstrated by the number
of employees by estimating the data from the Bank of
Local Data. The selectivity assumed in modeling was
λ = 0.00002652
4
. The area of study covered the division
into 337 regions.
The analyses were conducted in several teams. Each
of them analyzed the quantitative and qualitative changes
in several variants of exclusion of nodes (junctions). The
following is an example of a presentation of analyses
conducted on the network of Łódź. Figure 1 shows the
exclusion of one section in the network as well as the
quantitative and percentage changes in the network.
Figure 2 presents the variant approach with the exclu-
sion of several (1 or 2–3) junctions at the same time. At
this stage, the analyses provided the preliminary evalu-
ation of the sensitivity of the transportation network in
Łódź and the importance of individual nodes (junctions)
in causing changes in the load distribution in the whole
city transportation system. Each of the teams evaluated the
quantitative and percentage changes in the city transporta-
tion system for another node of a group of nodes.
The numbers regarding the inuence of the exclusion
of the node on the whole network are useful for further
studies and possible application of variant results. The
qualitative changes, meaning the changes in the average
3
Employee of the Chair of Spatial Planning, Faculty of Archi-
tecture, University of Science and Technology in Wrocław.
4
λ – probability of the potential acceptance of the destination of
contacts, assuming the minimum of, e.g. time, cost, effort.
Analizy systemów transportowych/Analyses of transport systems 89
time of all trips, should be taken into account. The change
in the average time of all trips demonstrates how much
longer (on average) a vehicle will remain in trafc in the
transportation network. It can be translated into the costs
connected with the increase in exhaust emissions, trafc
jams, and commuting costs.
One of the major conclusions regarding the ways in
which analyses should be conducted is the conrmation
of the necessity to conduct further, more comprehensive
studies, extended to include other contacts (not only
home–work). In this case in order to generate compre-
hensive results it would be necessary to do the modeling
of the way back home from work. The loads and load
niego czasu wszystkich podróży powinny być brane pod
uwagę. Zmiana średniego czasu wszystkich podróży ob-
razuje, o ile dłużej (średnio) pojazd będzie znajdował się
w ruchu w sieci komunikacyjnej. Można to przełożyć na
koszty związane ze wzrostem emisji spalin, powstawa-
niem korków oraz koszty dojazdu.
Jednym z ważnych wniosków dotyczących sposobu
wykonywania analiz jest potwierdzenie konieczności
pro wadzenia dalszych, bardziej całościowych badań,
uzu pełnionych o inne kontakty (nie tylko dom–praca).
W tym wypadku do uzyskania kompleksowych wyni-
ków niezbędne byłoby przeprowadzenie modelowań
drogi powrotnej z pracy do domu. Uzyskane obciążenia
Il. 1. Przykładowa analiza
z wycięciem jednego odcinka
w istniejącej sieci Łodzi
(źródło: analizy zespołu stu-
dentów, materiał wykonany na
zajęciach z przedmiotu „Techniki
analiz i prognoz transportowych”
prowadzonych w Katedrze
Planowania Przestrzennego
w semestrze zimowym
2014/2015)
Fig. 1. Example analysis with
exclusion of one section of the
existing network in Łódź
(source: analyses by a team of
students, material developed in
classes in the facultative subject
the “Techniques of Transpor-
tation Analyses and Forecasts”
at the Chair of Spatial Planning
in winter semester 2014/2015)
Il. 2. Przykładowa analiza
z wycięciem grupy węzłów
(odcinków) w istniejącej sieci
Łodzi (źródło: analizy zespołu
studentów, materiał wykonany
na zajęciach z przedmiotu
„Techniki analiz i prognoz trans-
portowych” prowadzonych
w Katedrze Planowania
Przestrzennego w semestrze
zimowym 2014/2015)
Fig. 2. Example analysis with
exclusion of a group of nodes
(sections) (source: analyses by
a team of students, material
developed in classes in
the facultative subject the
“Techniques of Transportation
Analyses and Forecasts” at the
Chair of Spatial Planning in
winter semester 2014/2015)
Węzeł numer 1, skrzyżowanie ulic Limanowskiego oraz Włókniarzy
Node number 1, intersection of Limanowskiego and Włókniarzy streets
Grupa węzłów numer 2 w rejonie ul. Limanowskiego
Group of number 2 nodes in the region of Limanowskiego Street
90 Marzena H. Heliak
i zmiany obciążeń charakteryzują się dużym stopniem
asymetryczności. Interpretowanie ich w oderwaniu od
podróży powrotnej może doprowadzić do niepoprawnych
wniosków.
Opole – opis przykładu
Podobnie jak w przypadku Łodzi, praca studentów od-
bywała się w zespołach. Dla każdej z grup określono to
samo zadanie, które polegało na przeprowadzeniu trzech
wariantów modelowań rozkładu podróży w zależności od
wyboru pierścieni odległości dla:
– jednego punktu źródłowego,
– dwóch punktów źródłowych oraz dla aktywności
źródłowych rozlokowanych proporcjonalnie we wszyst-
kich rejonach miasta Opola.
Możliwe były modykacje w poszczególnych zespo-
łach co do założeń parametru selektywności przyjętego
od λ = 0,0000211 do λ = 0,000033 przy prawdopodobień-
stwie zaspokojenia podróży (z) od 80% do 92%. Zadanie
różniło się również przyjętą liczbą pierścieni odległości
– od 3 do 5. Dla każdego wariantu wybrano odpowiednią
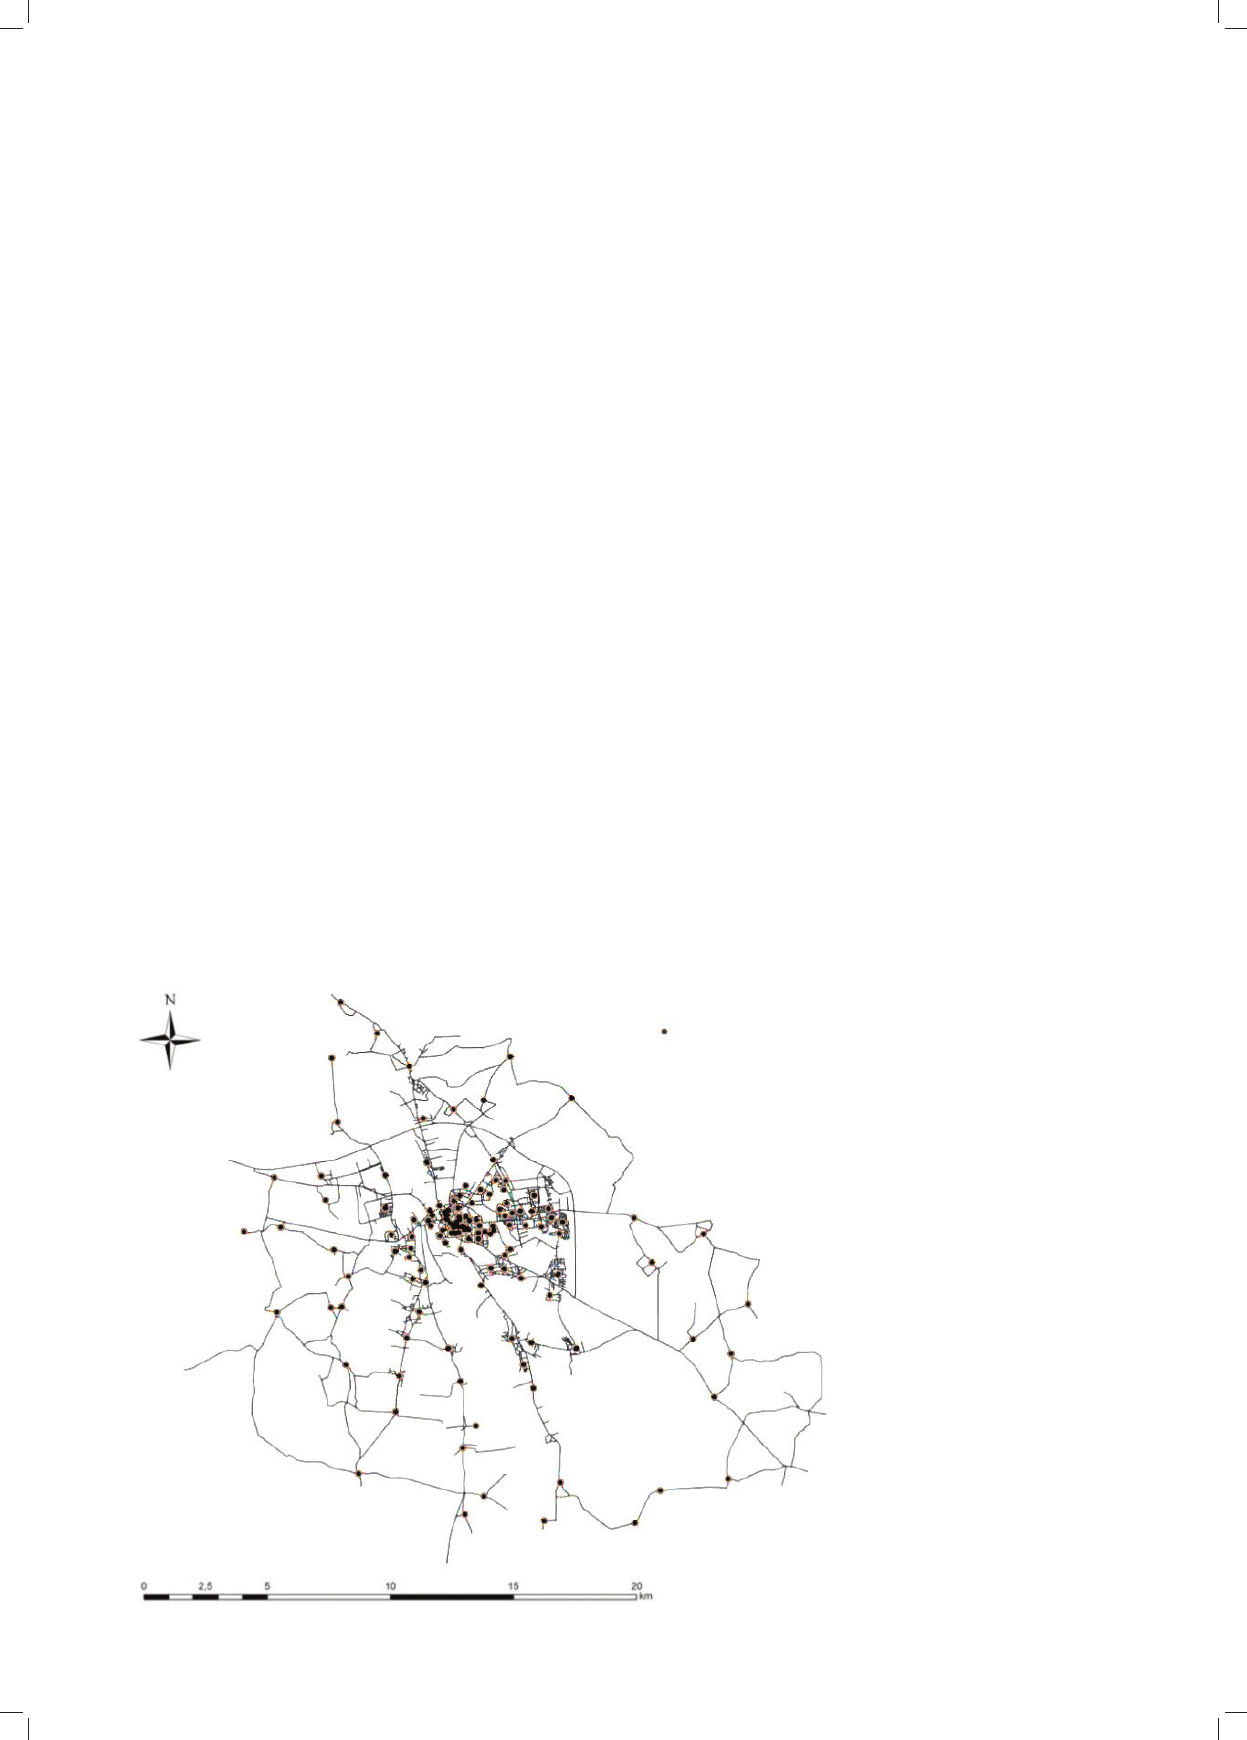
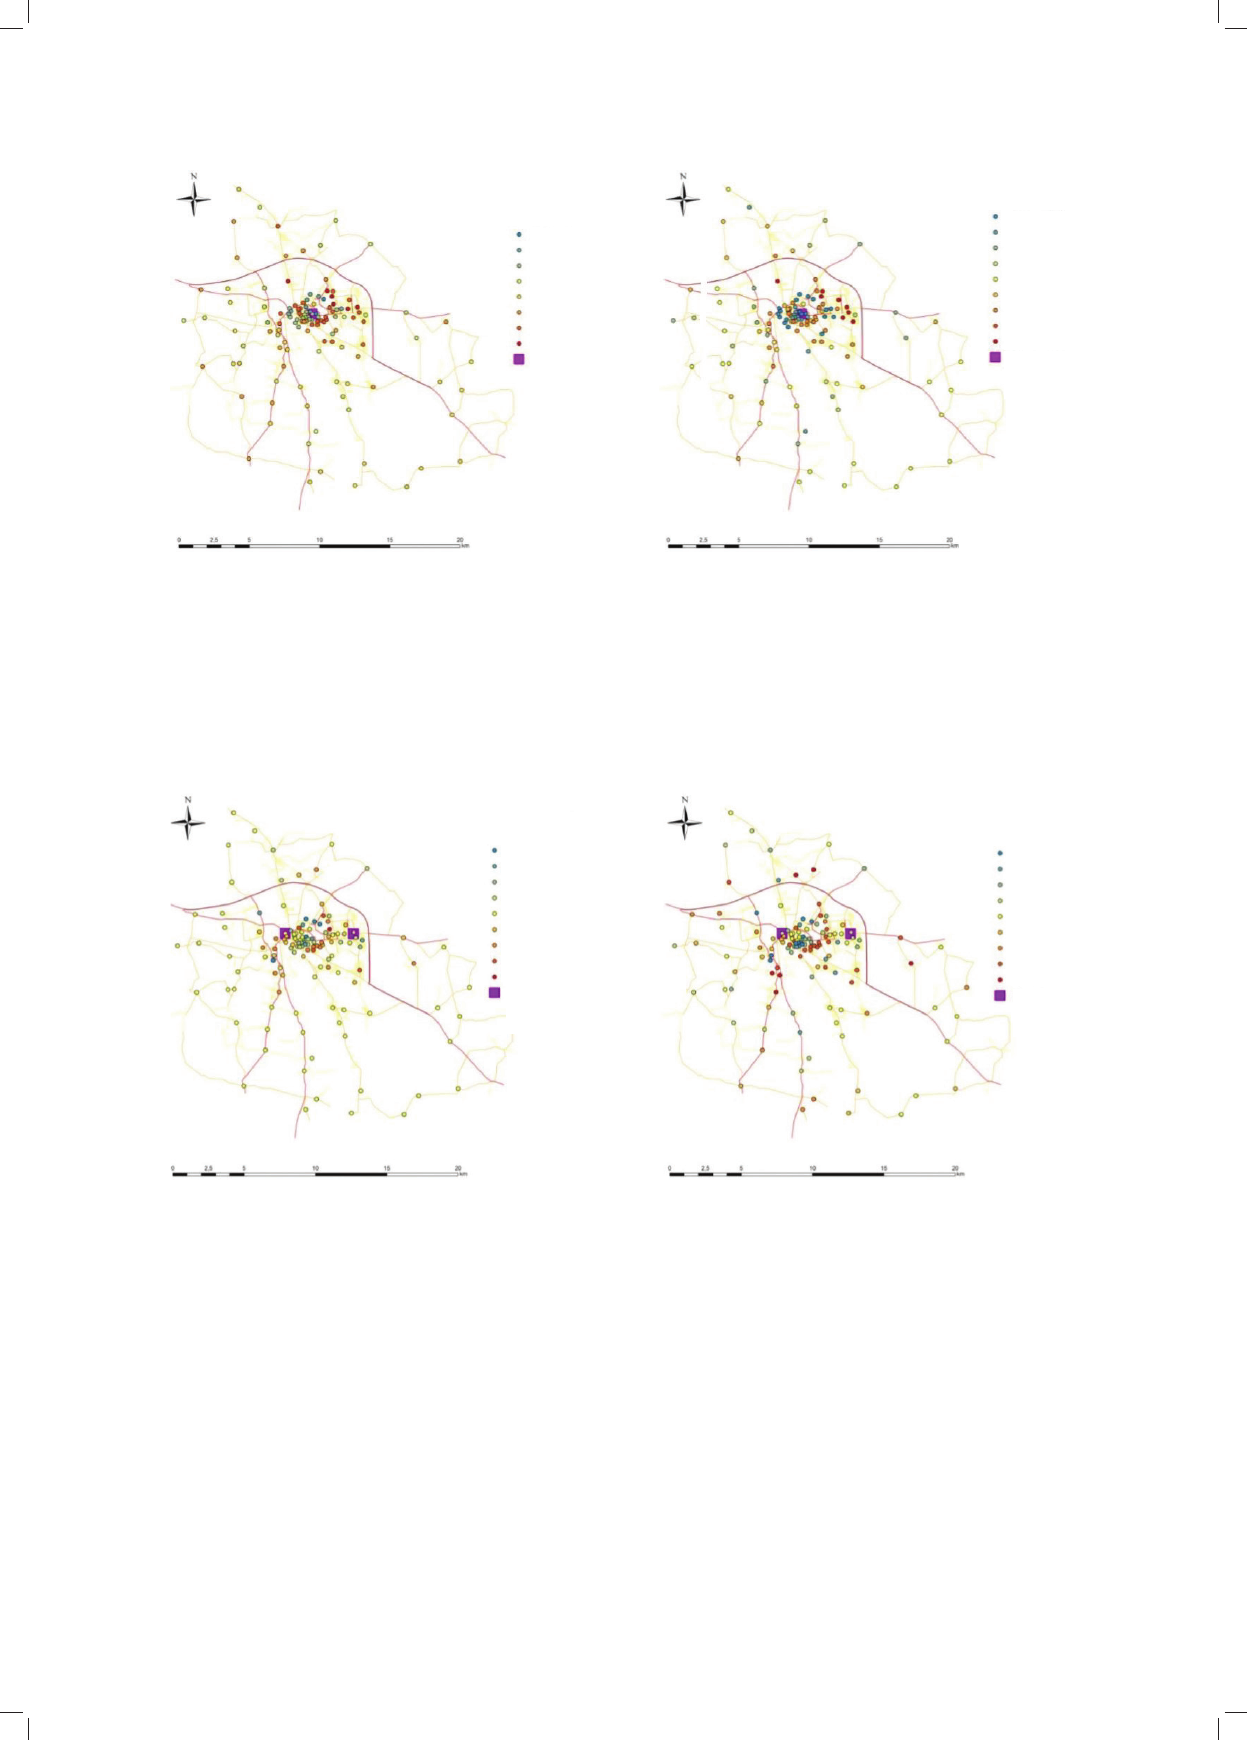
liczbę pierścieni odległości badaną przez zespół (il. 3–5).
W tym podejściu studenci starali się sami być operato-
rami swoich modelowań. Wymagało to od nich stworze-
nia odpowiedniej procedury modelującej i zapisywania jej
w języku Python jako zbiór procedur z zaimplementowa-
nych wcześniej elementów.
W modelowaniach został potwierdzony wpływ (przy
ustalonej wartości parametru selektywności) gęstości
przedziału penetrowanej przestrzeni na pierścienie od-
changes are highly asymmetric. Interpreting them sepa-
rately from the trip back home can provide erroneous
conclusions.
Opole – case description
Just like in the case of Łódź, the students worked in
teams. Each of the groups was assigned the same task
which consisted in conducting three modeling variants of
the distribution of trips, depending on the choice of dis-
tance rings for:
– one source point,
– two source points and for source activities located
proportionately in all regions of the city of Opole.
It was possible to modify in individual teams the as-
sumptions of the selectivity parameter which was assumed
at λ = 0.0000211 to λ = 0.000033 with the likelihood of
trip satisfaction (z) from 80% to 92%. The task varied
also in respect of the assumed number of distance rings –
from 3 to 5 rings. An adequate number of distance rings
was assumed for each of the variant studied by the team
(Fig. 3–5).
In this approach the students tried to operate their mod-
elings themselves. This required them to develop a proper
procedure of modeling and record it in the Python lan-
guage as a set of procedures with earlier implemented
elements.
The modelings conrmed the inuence (with the xed
value of selectivity parameter) of the penetration space
density on the distance rings for individual source regions.
The higher its value, the higher the likelihood of nishing
Il. 3. Rozmieszczenie 130 re jo-
nów obliczeniowych Opola
(źródło: analizy zespołu
studentów, materiał wykonany
na zajęciach z przedmiotu
„Techniki analiz i prognoz
transportowych” prowadzonych
w Katedrze Planowania
Przestrzennego w semestrze
zimowym 2015/2016)
Fig. 3. Distribution of
130 calculation regions in Opole
(source: analyses by a team of
students, material developed in
classes in the facultative subject
the “Techniques of Trans por-
tation Analyses and Forecasts”
at the Chair of Spatial Planning
in winter semester 2015/2016)
re jo ny obliczeniowe
calculation regions
Legenda/Legend
Analizy systemów transportowych/Analyses of transport systems 91
ległości dla poszczególnych rejonów źródłowych. Im
większa jego wartość, tym większe prawdopodobieństwo
zakończenia podróży wcześniej. Zmiana liczby pierście-
ni odległości miała natomiast nieznaczny wpływ przy
małych zmianach dla całości obrazu wymiany ruchu. Na
tym etapie prac wykazano dla dobranych parametrów
własność szczególną wpływu liczby pierścieni odległości.
Należałoby w dalszym cyklu dydaktycznym rozszerzyć
the trip earlier. However, the change in the number of the
distance rings slightly affected the whole picture of trafc
exchange when the changes were small. At this stage of
works, a special quality of the inuence of the number of
distance rings was determined for the selected parameters.
The further course of instruction should be extended to
include the issue of inuence of the number of distance
rings on trafc exchange.
Il. 4. Bezwzględna i procentowa różnica w rozkładzie aktywności dla jednego punktu źródłowego
pomiędzy 3- i 1-minutowym pierścieniem odległości (źródło: analizy zespołu studentów,
materiał wykonany na zajęciach z przedmiotu „Techniki analiz i prognoz transportowych”
prowadzo nych w Katedrze Pla no wania Przestrzennego
w se mes trze zimowym 2015/2016)
Fig. 4. Absolute and percentage difference in the distribution of activities for one source point
between 3- and 1-minute distance rings (source: analyses by a team of students,
material developed in classes in the facultative subject the “Techniques of Transportation Analyses and Forecasts”
at the Chair of Spatial Planning in winter semester 2015/2016)
Il. 5. Bezwzględna i procentowa różnica dla dwóch punktów źródłowych w rozkładzie aktywności
pomiędzy 3- i 1-minutowym pierścieniem odległości (źródło: analizy zespołu studentów,
materiał wykonany na zajęciach z przedmiotu „Techniki analiz i prognoz transportowych”
prowadzonych w Katedrze Planowania Przestrzennego w semestrze zimowym 2015/2016)
Fig. 5. Absolute and percentage difference in the distribution of activities for two source points
between 3- and 1-minute distance rings (source: analyses by a team of students,
material developed in classes in the facultative subject the “Techniques of Transportation Analyses and Forecasts”
at the Chair of Spatial Planning in winter semester 2015/2016)
Legenda/Legend
Legenda/Legend Legenda/Legend
Legenda/Legend
różnice/variants
różnica 3–1 min/3–1 min variant
różnica 3–1 min/3–1 min variant
-12,7 – -5,4
-5,3 – -2,5
-2,4 – -1,3
-1,2 – -0,4
-0,3 – +0,4
+0,5 – -1,4
+1,5 – +2,6
+2,7 – +5,0
+5,1 – +9,8
-10,8 – -6,1
-6,0 – -2,1
-2,0 – -0,6
-0,5 – -0,1
0,0
+0,1 – +0,5
+0,6 – +3,0
+3,1 – +4,9
-25,0 – -15,5
-15,4 – -9,1
-9,0 – -4,9
-4,8 – -2,1
-2,0 – +2,2
+2,3 – +8,5
+8,6 – +18,0
+18,1 – +32,3
+32,4 – +53,7
-23,7 – -10,2
-19,1 – -11,6
-11,5 – -5,4
-5,3 – -2,1
-2,0 – +2,0
+2,1 – +4,7
+4,8 – +7,7
+7,8 – +17,7
+17,8 – +35,7
różnice 3–1 min [%]/3–1 min [%] variants
różnice 3–1 min [%]/3–1 min [%] variants
źródło podróży
source of journey
źródła podróży
sources of journey
źródła podróży
sources of journey
źródło podróży
source of journey
92 Marzena H. Heliak
problematykę badania wpływu liczby pierścieni odległo-
ści na wymianę ruchu.
Wałbrzych – ogólny opis przykładu
Analiza układu komunikacyjnego Wałbrzycha jest
bardzo interesująca ze względu na porównania wyników
empirycznych badań przeprowadzonych w roku 1967
z dzisiejszymi możliwościami technicznymi podejścia
modelowego, z wykorzystaniem modelu pośrednich moż-
liwości.
Celem przeprowadzonych prac było sprawdzenie, czy
metoda cofania nadwyżek daje bardzo odległy obraz i czy
różni się w porównaniu z danymi empirycznymi, obliczo-
nymi w terenie w 1967 r.
Do przeprowadzenia modelowań zostały wykorzystane
następujące dane:
– liczba rejonów obliczeniowych: 22,
– liczba aktywności źródłowych: 53 713,
– liczba aktywności celowych: 53 713,
– liczba zastosowanych pierścieni odległości: 8,
– liczba iteracji: 6.
W każdej iteracji cofane były nadwyżki przydzielane
przez model pośrednich możliwości.
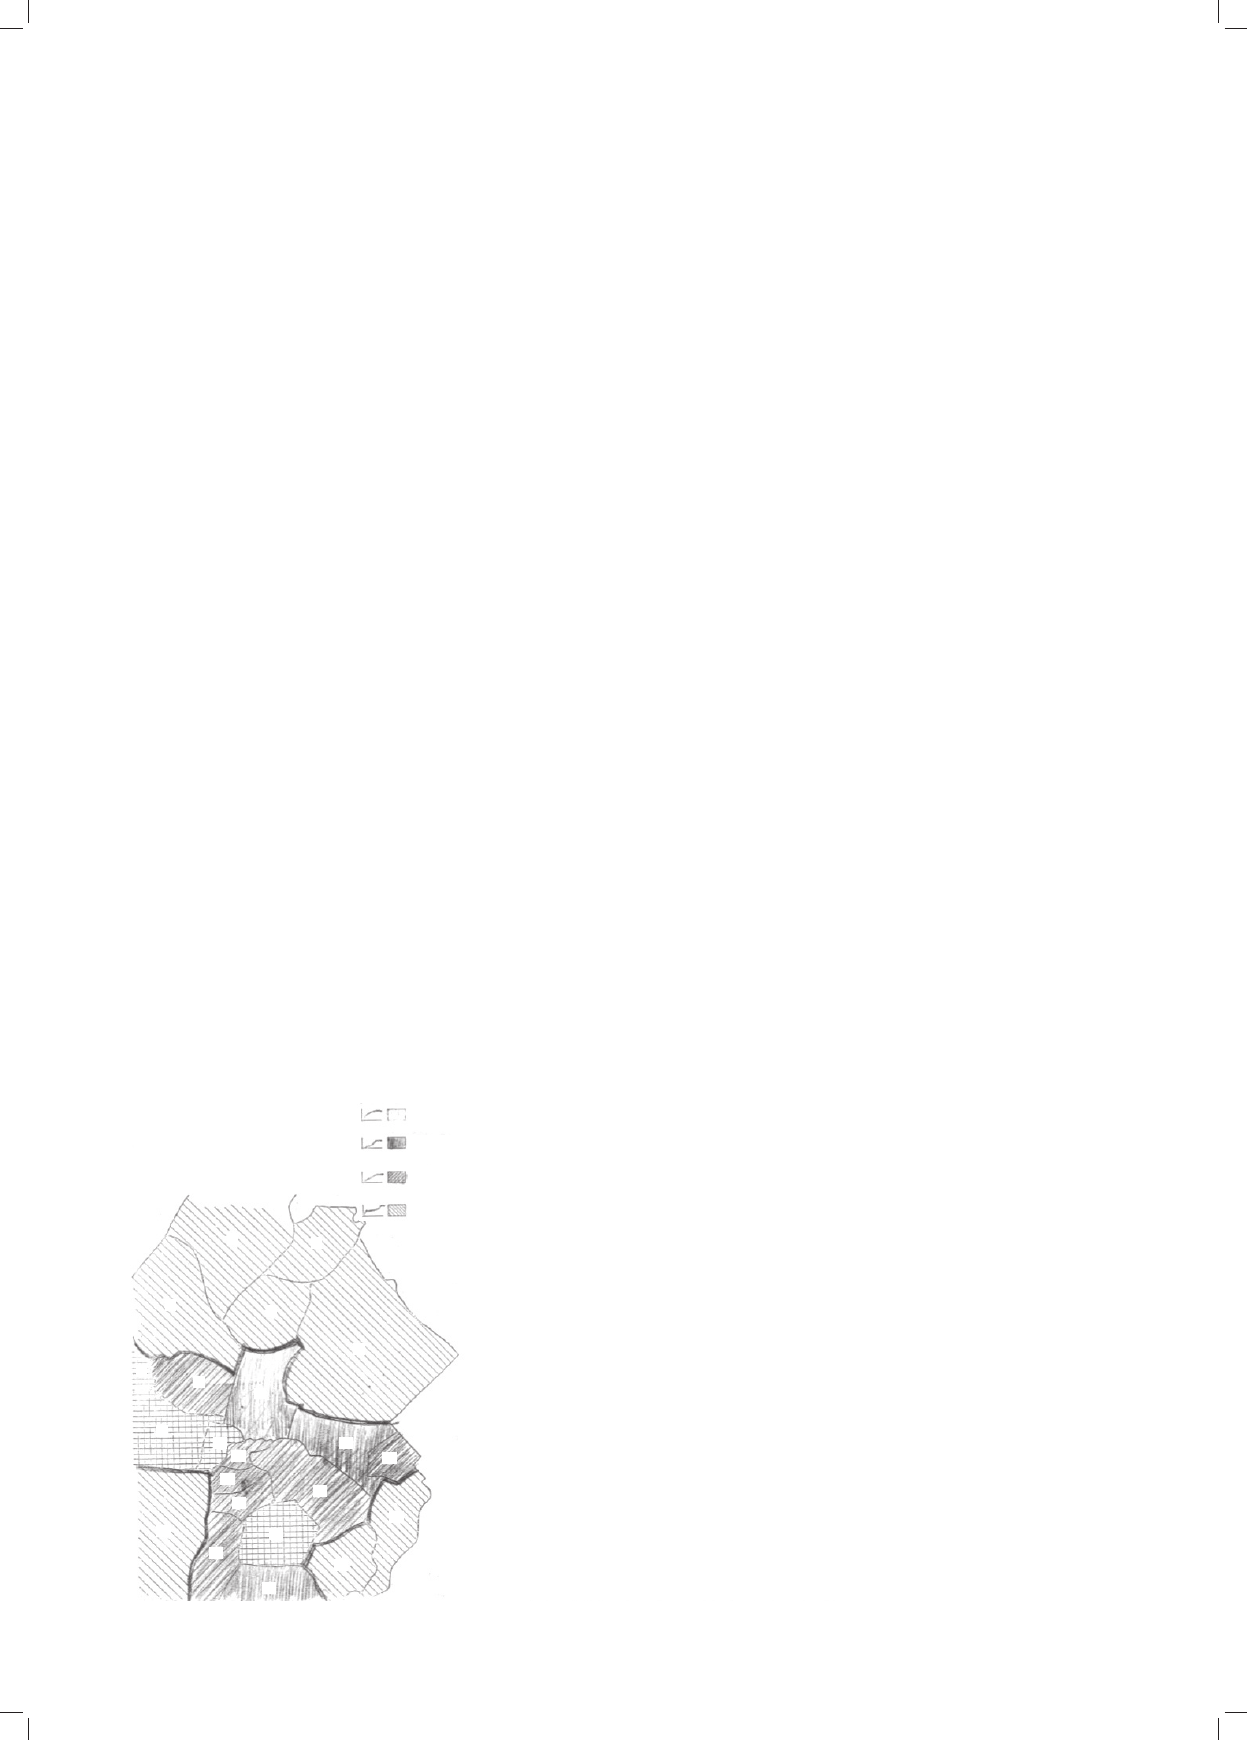
Współczynnik selektywności przyjęto zgodnie z tabelą
przedstawioną na ilustracji 6.
W celu zobrazowania omawianej problematyki wy-
brano przykładowe analizy z wszystkich przeprowadzo-
nych dla 22 rejonów (il. 6). Na ilustracji 7 przedstawiono
wyniki analizy dla rejonu 11 – Śródmieście 1. Dokonano
zestawienia wyników z roku 1967 oraz współczesnych
uzyskanych z wykorzystaniem modelu pośrednich moż-
liwości i wykonanych przez zespół studentów w ramach
zajęć w Katedrze Planowania Przestrzennego w semestrze
2015/2016, dla tego samego wydzielonego obszaru. Auto-
rem implementacji i operatorem algorytmów był mgr inż.
Maciej Kamiński.
Wałbrzych – general case description
The analysis of the transportation system in Wałbrzych
is very interesting due to the comparison of the results of
empirical studies conducted in 1967 with today’s techni-
cal possibilities of the model approach with the use of the
intervening opportunities model.
The objective of the conducted works was to check if
the of excess withdrawal method provides a very distant
picture and if it differs in comparison with empirical data
calculated in the eld in 1967.
The following data were used in the development of
modelings:
– number of calculation regions: 22,
– number of source activities: 53 713,
– number of destination activities: 53 713,
– number of applied distance rings: 8,
– number of iterations: 6.
The excess assigned by the intervening opportunities
model was withdrawn in every iteration.
The selectivity ratio was assumed in compliance with
the table in Figure 6.
The example analyses from all conducted analyses
were selected for 22 regions in order to present the is-
sues discussed here (Fig. 6). Figure 7 shows the results
of the ana lysis for region 11 – City Center 1. The re-
sults from 1967 were compared with the modern ones
which were generated with the use of the interven-
ing opportunities model by the team of students during
the classes at the Chair of Spatial Planning in semester
2015/2016 for the same area. The algorithms were im-
plemented and operated by Maciej Kamiński, M.Sc.
Comparing the two graphs for the region of City Cen-
ter 1 described with number 11, it can be noted that the
data generated as a result of modeling more or less cor-
respond to the empirical studies. A small noticeable dif-
ference is that when the excesses are withdrawn the des-
Il. 6. Rozmieszczenie rejonów
obliczeniowych oraz rozłożenie
źródeł i celów dla poszczegól-
nych rejonów obliczeniowych
(1–22). Materiał źródłowy
z badań 1967 r. dla Wałbrzycha
(Archiwum Katedry Planowania
Przestrzennego)
Fig. 6. Distribution of calcula-
tion regions and the distribution
of sources and destinations for
individual calculation regions
(1–22). Source material from
the studies conducted in 1967
for Wałbrzych (Archives of the
Chair of Spatial Planning)
Wałbrzych: typologia rejonów
w wyniku kalibracji wstępnej
parametrów
Wałbrzych: typology of regions
as a result of initial calibration
klasyczny
classical
splot d=0
early convolution
splot d<0
late convolution
„splot z prze su nię-
ciem strefy
rozmycia” d>0
previous
convolution
sd_id Src dst sel
rejon źródła cele selektywność
area sources destination selectivity
1 1126 202 0,0001896
2 1358 1722 0,0000875
3 5310 4050 0,0000484
4 3219 1823 0,0001572
5 5194 6177 0,000029
6 1106 91 0,0002577
7 380 20 0,0007052
8 4544 708 0,0000452
9 1616 506 0,000054
10 514 4557 0,000055
11 1038 2229 0,000029
12 1685 4152 0,000033
13 3692 12355 0,0000333
14 916 3544 0,0000307
15 3995 1620 0,0000505
16 4214 4759 0,0000793
17 3284 3646 0,0000438
18 777 23 0,000234
19 1710 304 0,0000747
20 282 10 0,0001512
21 6373 1013 0,000041
22 1380 202 0,0000337
6
2
1
4
7
8
5
10
11
13
15
14
17
18
19
21
22
20
16
12
9
3
Analizy systemów transportowych/Analyses of transport systems 93
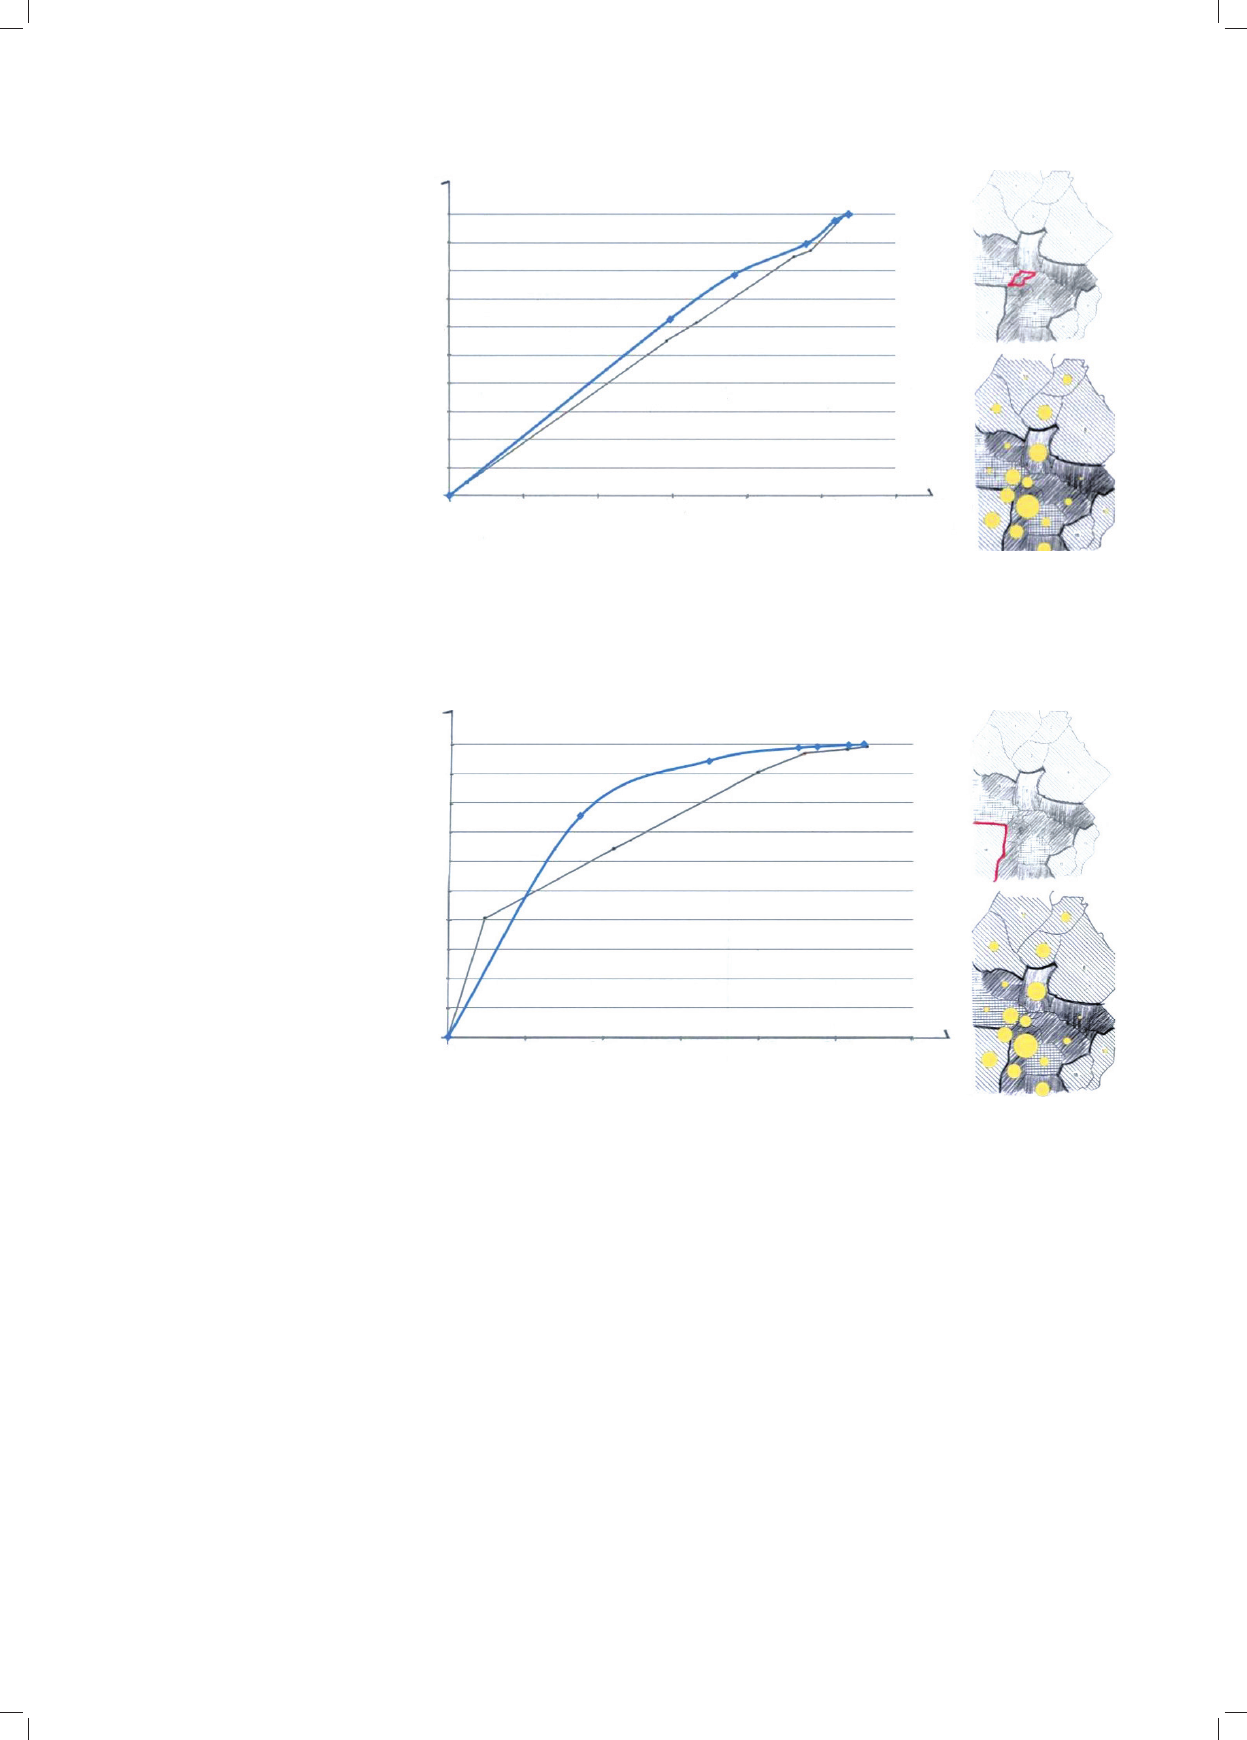
Porównując dwa wykresy dla rejonu Śródmieście 1,
opisanego numerem 11, można stwierdzić, że uzyskane
w wyniku modelowania dane w miarę się pokrywają z po-
miarami empirycznymi. Niewielka zauważalna różnica
polega na tym, że przy zastosowaniu cofania nadwyżek
nastąpiło nieco szybsze uzyskanie zaspokojenia celów, niż
to wykazują badania empiryczne. Modelowi „udało się”
nawet w pewnym stopniu odwzorować wklęsłość (il. 7),
która pojawia się na poziomie 85% zaspokojonych podróży.
Biorąc pod uwagę całość uzyskanych wyników, moż-
na stwierdzić, że podejście w cofaniu nadwyżek jedynie
w niektórych przypadkach jest zbliżone do rzeczywistości
w stopniu zadowalającym.
Jedynie rejon Sobięcin (il. 8), oznaczony numerem 16,
położony jest dalej od centrum, a zauważalna rozbieżność
tinations were achieved slightly faster than indicated by
empirical studies. The model even “managed” to present
a certain degree of concavity (Fig. 7) which is present with
85% of satised trips.
Taking into account all generated results, it can be
noted that the approach applied in excess withdrawal re-
sembles the reality satisfactorily only in some cases.
Sobięcin (Fig. 8) designated by number 16, is the only
region located farther from the center and the noticeable
difference between the results is the biggest in that case.
It can be concluded then that the location of the region in
respect of available destinations as well as its size signi-
cantly affect the generated results.
It is visible in almost every modeling that the needs
are satised faster for a given number of destinations in
Il. 7. Porównanie wymode-
lowanych wykresów dla rejonu
nr 11 (źródło: analizy zespołu
studentów, materiał wykonany
na zajęciach z przedmiotu wy -
bie ralnego „Techniki analiz
i prog noz transportowych”
prowa dzonych w Katedrze Pla-
no wania Przestrzennego w se -
mestrze zimowym 2015/2016)
Fig. 7. Comparison of modeled
graphs for region no. 11
(source: analyses by a team of
students, material developed in
classes in the facultative subject
the “Techniques of Transpor-
tation Analyses and Forecasts” at
the Chair of Spatial Planning
in winter semester 2015/2016)
Il. 8. Porównanie wymode-
lowanych wykresów dla rejonu
nr 16 (źródło: analizy zespołu
studentów, materiał wykonany na
zajęciach z przedmiotu wy bie -
ralnego „Techniki analiz i prog -
noz transportowych” prowa -
dzonych w Katedrze Planowania
Przestrzennego w semestrze
zimowym 2015/2016)
Fig. 8. Comparison of modeled
graphs for region no. 16
(source: analyses by a team of
students, material developed in
classes in the facultative subject
the “Techniques of Transpor-
tation Analyses and Forecasts”
at the Chair of Spatial Planning
in winter semester 2015/2016)
%
100
90
80
70
60
50
40
30
20
10
%
100
90
80
70
60
50
40
30
20
10
0
10 000
1
1
3
3
2
2
4
4
40 000
Śródmieście I (11)/City Center I (11)
Ruchy do pracy/Movement to work
REJON 11 – Śródmieście I
REGION 11 – City Center I
REJON 16 – Sobięcin
REGION 16 – Sobięcin
Sobięcin (16)
Ruchy do pracy/Movement to work
1 – wyniki badań z 1967 r., 2 – wyniki badań z 2016 r., 3 – położenie rejonu,
4 – liczba osób zamieszkujących obszar – źródła
1 – results of studies from 1967, 2 – results of studies from 2016, 3 – location of the region,
4 – number of people living in the area – sources
1 – wyniki badań z 1967 r., 2 – wyniki badań z 2016 r., 3 – położenie rejonu
4 – liczba osób zamieszkujących obszar – źródła
1 – results of studies from 1967, 2 – results of studies from 2016, 3 – location of the region,
4 – number of people living in the area – sources
50 000
60 000 Cele
Destinations
Destinations
Cele
30 000
20 000
0
10 000 40 000
50 000
60 00030 000
20 000

94 Marzena H. Heliak
pomiędzy wynikami jest w tym przypadku największa.
Można więc wnioskować, że miejsce położenia rejonu
względem dostępnych celów, a także jego wielkość mają
znaczący wpływ na uzyskane wyniki.
Zauważalnym niemal w każdym modelowaniu zjawi-
skiem jest szybsze zaspokajanie potrzeb dla danej licz-
by celów w porównaniu z danymi empirycznymi. Taka
sytuacja być może wynika z lokalizacji rejonów, w któ-
rych były przeprowadzane modelowania, oraz z doboru
selektywności. Warto zauważyć, że niemal wszystkie
analizowane rejony znajdują się w centrum miasta, gdzie
występuje największe nagromadzenie celów.
Istotnym wątkiem realizowanym w trakcie zajęć ze
studentami przez pracowników Katedry Planowania
Przestrzennego były działania empiryczne. Miały one za
zadanie sprawdzenie zastosowań metody badawczej Ta-
deusza Zipsera [1].
Ocena ruchu miejskiego
z wykorzystaniem metody Tadeusza Zipsera
Badania terenowe miały przynieść praktyczne infor-
macje na temat sposobu prowadzenia takiego typu prac.
Dotyczyły one głównie zwerykowania założeń metody
Tadeusza Zipsera [1], dedykowanej badaniom – z różnych
perspektyw – obciążeń ruchem ciągów komunikacyjnych
w tkance miejskiej. Metoda ta koncentruje się głównie
na obserwacji ilościowej i jakościowej na wybranych
odcinkach systemu komunikacyjnego miasta i zliczaniu
pojazdów jadących w kierunku przeciwnym do badają-
cego. Osoba zliczająca pojazdy wykonywała to podczas
przemieszczania się jako pasażer samochodu osobowego
lub tramwaju. Uzupełniającym badaniem był pomiar natę-
żenia ruchu w wybranych punktach przy skrzyżowaniach,
tzw. badania „statyczne”. Szerzej o sposobie ich prowa-
dzenia w artykule pt. Metoda zbierania i opracowywania
danych o obciążeniach sieci transportowej [5].
W zastosowaniu jest to prosta metoda, jednakże wiążą
się z nią pewne ograniczenia. Jednym z nich jest to doty-
czące pogody i dostosowania prędkości jadącego pojazdu
do panujących uwarunkowań atmosferycznych. Kolejnym
czynnikiem mogącym utrudniać obserwację są elementy
wertykalne występujące na trasie przejazdu, tj. ekrany aku-
styczne, wiaty, przystanki i inne elementy przysłaniające
i uniemożliwiające obserwację ruchu pojazdów z naprze-
ciwka. Do pozytywnych stron tej metody należą natomiast
stosunkowo niski koszt jej stosowania, co jest ważne przy
ograniczonych środkach budżetowych, np. posiadanych
przez samorządowe jednostki terytorialne, oraz możliwość
jej przeprowadzenia w niewielkim zespole osobowym
i w krótkim czasie, wypływającym z potrzeb sprawdzenia
obciążeń natężeniem ruchu w małych i średnich miastach,
które nie mają opracowań objętych KBR dla Polski.
Badania we Wrocławiu – opis przykładu
Celem badania było m.in. porównanie wyników pomia-
rów metodą „dynamiczną” według Tadeusza Zipsera [1]
z rezultatami badań przeprowadzonych w ramach KBR
z 2010 r. [6] oraz sprawdzenie samej metody dynamicznej.
comparison to empirical data. Such a situation may result
from the location of the regions which were modeled and
from the selectivity choice. It should be noted that almost
all analyzed regions are located in the city center where
the concentration of destinations is the greatest.
The empirical activities conducted during the classes
with the students by the staff of the Chair of Spatial Plan-
ning were important and their objective was to verify the
application of Tadeusz Zipser’s research method [1].
Evaluation of the city traffic
with the use of Tadeusz Zipser’s method
The eld studies were supposed to provide practical
information on the way such work should be carried out.
They regarded primarily the verication of the assump-
tion of Tadeusz Zipser’s method [1], dedicated to studies
– from various perspectives – of the trafc loads in the
city fabric. The method focuses mainly on studying the city
transportation system on selected sections through quantita-
tive and qualitative observation and counting the vehicles
going in the opposite direction. The person counting the
vehicles did that while traveling as a car or tram passen-
ger. The study was complemented with the measurement
of trafc intensity – “static” studies – in selected points
at junctions. More on the way they were conducted in [5].
The application of the method is simple, however, it is
connected with some limitations. One of them regards the
weather and adjusting the speed of the vehicle to weather
conditions. Another one which can hinder observation is
the vertical elements along the way, such as noise barriers,
sheds, passenger shelters and other elements blocking the
view or preventing observation of trafc going from the op-
posite direction. On the positive note, the application of the
method is relatively inexpensive, which is important when
the budgetary funds are limited, e.g. those at the disposal
of local authorities and it is possible to use this method
by a small team and over a short period of time, which
can be necessary to evaluate the trafc intensity in small
and medium-sized cities which are not included in CTS for
Poland.
Studies in Wrocław – case description
The objective of study was e.g. to compare the mea-
surement results with the use of Tadeusz Zipser’s “dy-
namic” me thod [1] with the results of studies conducted
within CTS from 2010 [6] and to evaluate the dynamic
method itself.
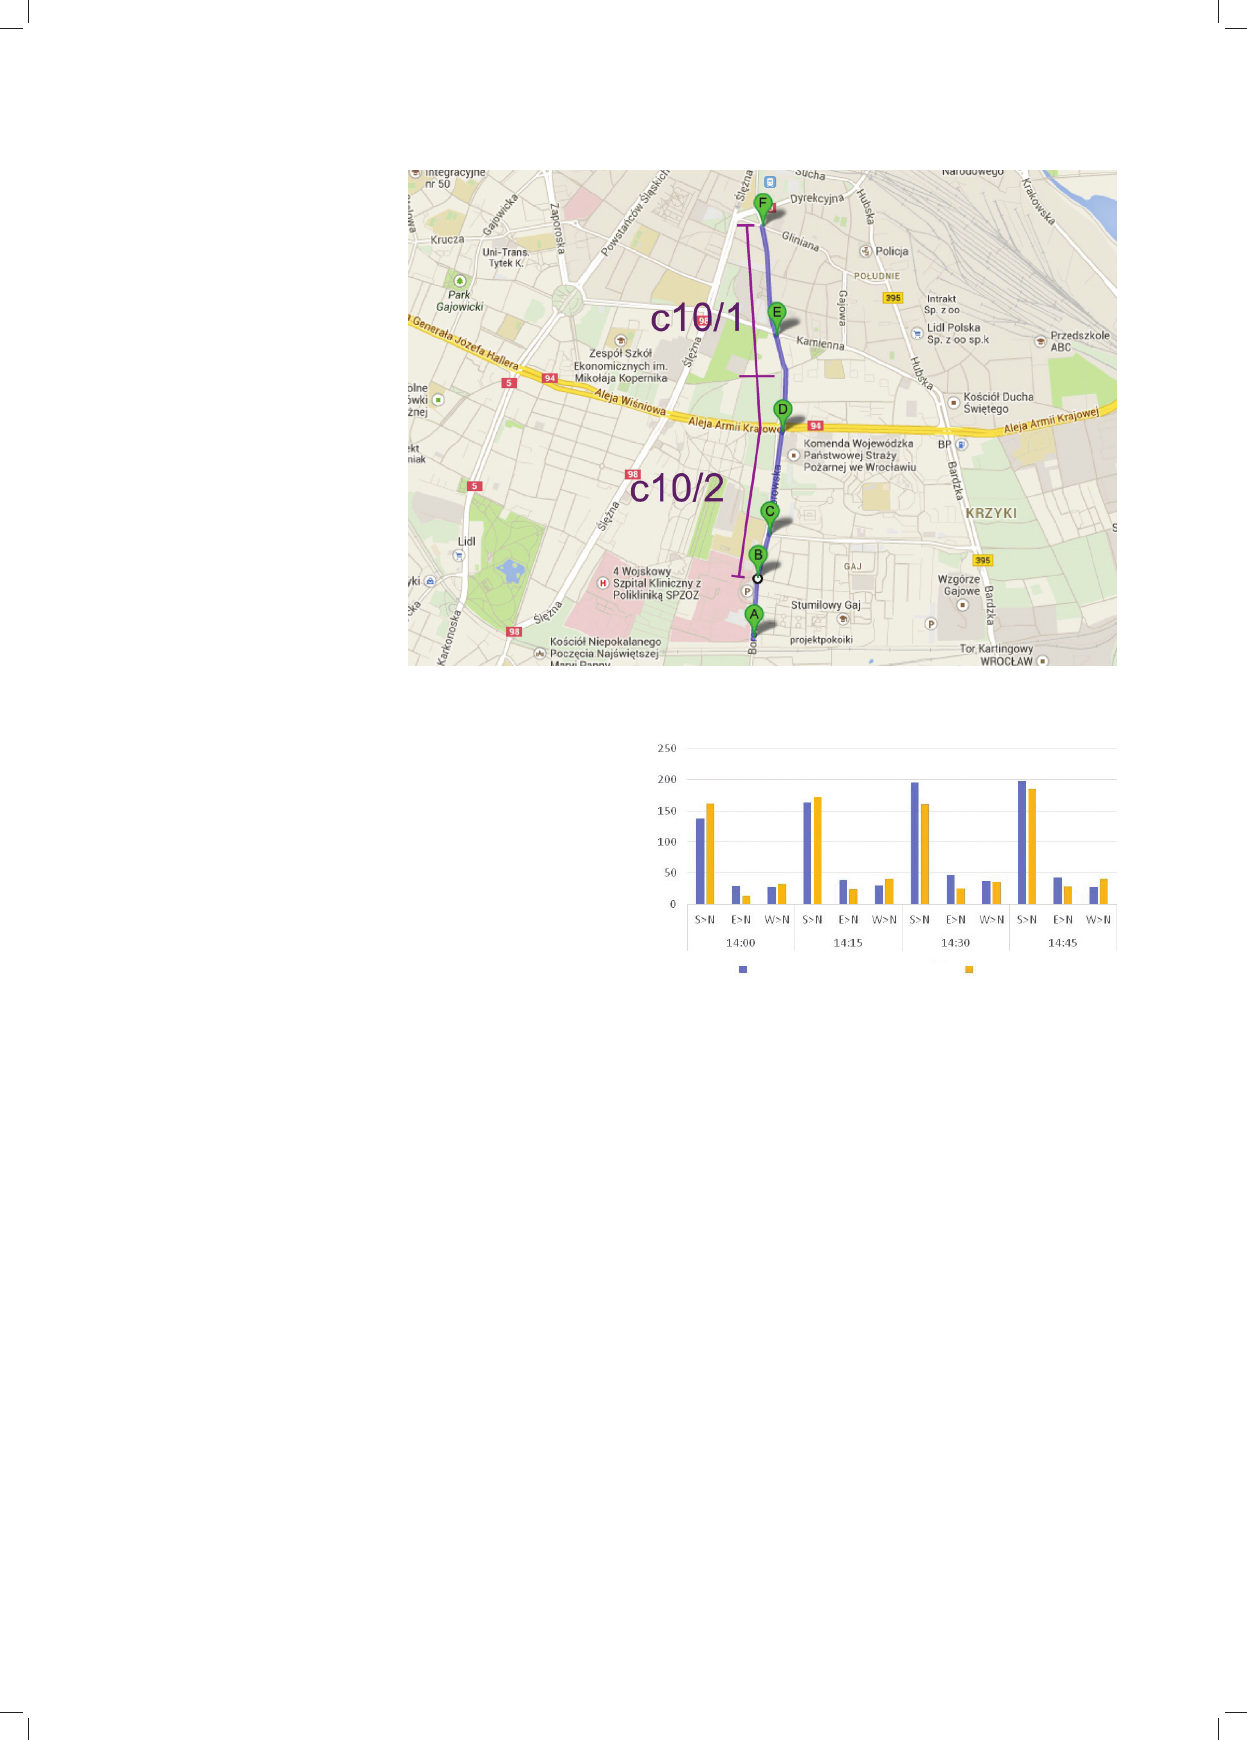
It is very important at the comparison stage to take
into account similar road sections (Fig. 9), periods of time
(every 15 minutes) (Fig. 10), etc.
The “dynamic” method, which involves observations
made as a car passenger on selected sections of the city
road network, in this case in Wrocław, has some limitations.
One important conclusion was drawn from the eld stud-
ies, namely the necessity to compare data collected from
two sources of observation, i.e. “dynamic” and “static” as
well as to normalize (rescale) the results due to a different
approach and the way of observation of trafc intensity.
Analizy systemów transportowych/Analyses of transport systems 95
Bardzo ważnym aspektem etapu porównywania jest
uwzględnienie podobnych odcinków dróg (il. 9), okresów
czasowych (w odstępach co 15 minut) (il. 10) itp.
Metoda „dynamiczna”, która zakładała obserwacje
jako pasażer samochodu m.in. na wybranych odcinkach
sieci drogowej miasta, w tym przypadku we Wrocławiu,
jest obarczona pewnymi już wspomnianymi ogranicze-
niami. W ramach przeprowadzonych badań terenowych
m.in. otrzymano jeden z istotnych wniosków dotyczący
konieczności porównywania danych z dwóch ujęć obser-
wacji, tj. „dynamicznej” i „statycznej” oraz wprowadzenia
normalizacji (przeskalowania) rezultatów, wynikających
z odmiennego podejścia i sposobu obserwacji natężenia
ruchu.
Badanie „statyczne” – zliczanie pojazdów w określo-
nych punktach – różni się od badania metodą „dynamicz-
ną”. W tej drugiej należy uwzględnić prędkość porusza-
jącego się samochodu w stosunku do pojazdów jadących
z naprzeciwka. W efekcie w tej samej jednostce czasu
w metodzie „dynamicznej” zlicza się więcej pojazdów
niż w badaniu „statycznym”, wobec czego należy prze-
skalować wyniki uzyskane ze zliczania pojazdów meto-
dą „dynamiczną”, dzieląc je przez dwa. Wnioskiem, jaki
płynie z badania metodą „dynamiczną”, jest stwierdzenie
konieczności dalszych badań porównawczych w kontek-
ście udoskonalenia tej metody.
W trakcie zajęć były omawiane różne problemy doty-
czące sposobu realizacji badania metodą „dynamiczną”,
przygotowania i przeprowadzenia badania metodą „sta-
tyczną” oraz porównania otrzymanych wyników z danymi
uzyskanymi na tych samych odcinkach w ramach KBR [6].
Wnioski
Model pośrednich możliwości nabiera większego zna-
czenia w obecnym podejściu do rozwoju szeroko rozu-
mianego transportu w miastach, regionach oraz większych
The “static” study – counting vehicles in specic points
– differs from the study conducted with the use of the
“dynamic” method. The latter should take into account
the speed of moving cars in relations to the vehicles going
from the opposite direction. In effect, more vehicles are
counted in the “dynamic” than in the “static” study over
the same time unit, which is why the results of counting
vehicles with the use of the “dynamic” method should be
rescaled by dividing them by two. The conclusion drawn
from the study conducted with the use of the „dynamic”
method is that it is necessary to conduct further compara-
tive studies in order to improve this method.
During the classes, different issues were discussed,
such as the way in which the study should be prepared
and conducted with the use of the “dynamic” and “static”
Il. 9. Wybrany odcinek do badań
C10 (źródło: analizy zespołu stu-
dentów, materiał wykonany na
zajęciach z przedmiotu „Techniki
analiz i prognoz transportowych”
prowadzonych w Katedrze
Planowania Przestrzennego
w semestrze zimowym
2013/2014)
Fig. 9. Selected section for
the study of C10
(source: analyses by a team of
students, material developed in
classes in the facultative subject
the “Techniques of Transpor-
tation Analyses and Forecasts”
at the Chair of Spatial Planning
in winter semester 2013/2014)
Il. 10. Wybrane zestawienie pomiaru na odcinku C10 (źródło: analizy
zespołu studentów, materiał wykonany na zajęciach z przedmiotu
„Techniki analiz i prognoz transportowych” prowadzonych w Katedrze
Planowania Przestrzennego w semestrze zimowym 2013/2014)
Fig. 10. Selected comparison of measurement results for section C10
(source: analyses by a team of students, material developed in classes
in the facultative subject the “Techniques of Transportation Analyses
and Forecasts” at the Chair of Spatial Planning in winter
semester 2013/2014)
Suma/Sum
Nasz pomiar
Our measurement
KBR
CTS

96 Marzena H. Heliak
obszarach. Tematyka ta oraz konieczność analizowania
zjawisk w strukturze osadniczej stawia przed zespołem
Katedry Planowania Przestrzennego kolejne wyzwania
i potrzebę udoskonalenia samego modelu pośrednich moż-
liwości. Wywołane problemy stanowią jedynie przedsmak
potencjału tkwiącego w aplikacyjnym zastosowaniu za-
równo omawianego modelu, jak i metody „dynamicznej”
do badania miejskich struktur osadniczych, a w szczegól-
ności do analizy zagadnień transportowych.
method as well as the comparison of the results with the
data generated for the same sections in CTS [6].
Conclusions
The intervening opportunities model is more and more
important with the current approach to the growth of trans-
portation system in its broad meaning in the cities, regions
and bigger areas. Those issues and the necessity to ana-
lyze the developments taking place within the settlement
structure create new challenges for the team of the Chair
of Spatial Planning and the need to improve the interven-
ing opportunities model itself. The issues only point to
the potential hidden in the application of the model in
question as well as the “dynamic” method to study the
urban settlement structures and in particular to analyze
the transportation issues.
Translated by
Tadeusz Szałamacha
Bibliografia /References
[1] Zipser T., Analiza ruchu samochodów ciężarowych na obszarze
miasta Wrocławia. Dobór technik pomiaru, pilotażowe badania
terenowe, raport na prawie rękopisu, Wydział Architektury PWr,
Wrocław 1999.
[2] Bagiński E., Litwińska E., Zipser T., Próby symulacji modelowej
rozkładu przestrzennego ruchu turystycznego w Polsce, Ocyna
Wydawnicza PWr, Wrocław 1995.
[3] Zipser T., Struktura trójkątowołańcuchowa sieci osadniczej,
„ Zeszyty Naukowe Politechniki Wrocławskiej. Architektura” 1967,
z. 9, 3–49.
[4] Zipser T., Mlek M., Samochodowy transport ciężarowy, [w:] K. Le-
wandowski (red.), Miasto Wrocław. Przestrzeń komunikacji i trans-
port, Ocyna Wydawnicza PWr, Wrocław 2004, 261–284.
[5] Grabińska T., Kamiński M., Metoda zbierania i opracowania da-
nych o obciążeniu sieci transportowej, „Logistyka” 2014, Nr 6,
4162–4168.
[6] Kompleksowe Badania Ruchu (KBR) dla Wrocławia, Biuro Inży-
nierii Transportu Pentor Metoda zbierania i opracowania danych
o obciążeniu sieci transportowej Researcher International SA,
Poznań 2010.
Streszczenie
W artykule scharakteryzowano problematykę, jaką realizowano w trakcie procesu dydaktycznego na kierunku gospodarka przestrzenna na Wydziale
Architektury Politechniki Wrocławskiej, w ramach przedmiotu „Techniki analiz i prognoz transportowych”. Na przykładzie Łodzi, Opola, Wałbrzy-
cha oraz Wrocławia przedstawiono i zanalizowano wybrane zagadnienia związane z założeniami modelu pośrednich możliwości, wykorzystywanego
w modelowym podejściu do zjawisk przestrzennych w miejskich strukturach osadniczych. Przybliżono również eksperyment podjęty i realizowany
w procesie dydaktycznym, służący ocenie ruchu miejskiego, wykorzystujący metodę badawczą opracowaną przez prof. Tadeusza Zipsera.
Słowa kluczowe: analizy transportowe, model pośrednich możliwości, rozwój
Abstract
The article characterises selected issues and problems included in the teaching process of the course “Techniques of transport analyses and forecasts”
at the studies in Spatial Planning Faculty of Architecture at Wrocław University of Science and Technology. Examples of such as Łódź, Opole,
Wałbrzych and Wrocław were used to present and analyse selected issues related to the concept of the intervening opportunities model applied in
the model approach to spatial phenomena at urban settlement structures. The course covered also the experiment undertaken to assess the urban
trafc applying the research method developed by prof. Tadeusz Zipser.
Key words: transport analyses, the intervening opportunities model, development