2020
3(63)
DOI: 10.37190/arc200307
Wprowadzenie
Fascynującym zagadnieniem są zmiany proporcji
wzno szonych budowli sakralnych. Dobrze widać to
w gotyku. Wraz z ewolucją stylu ścierały się dwie ten-
dencje – do wydłużania układów katedr i do ich pod-
wyższania oraz wysmuklania proporcji przekrojów ich
naw głównych i bocznych. Jest to zderzenie „wgłębnego
horyzontalizmu” mającego na celu manifestację dążenia
ku miejscu mistycznej przemiany chleba i wina w ciało
i krew Chrystusa z wertykalizmem ukazującym oderwa-
nie myśli ludzkich od spraw przyziemnych ku sklepieniu
reprezentującemu nieboskłon. Zdaniem Justyny Spruty to
konsekwentne wypiętrzanie struktur gotyckich kierowa-
ło spojrzenie wiernych ku górze, wyznaczając duchowy
tor dla modlitwy wspólnotowej indywidualnej [1]. Temat
symboliki ukrytej w gotyckich bryłach kościołów oma-
wia wielu historyków sztuki, architektów i teologów,
wśród których wymienić można Georges’a Duby’ego [2],
Edwarda Normana [3], Romana Walczaka [4], Otto von
Simsona [5], Wojciecha Bałusa [6], Alaine Erlande-Bran-
denburg [7] czy Erwina Panovskiego [8].
Marta Rusnak*, Joanna Szewczyk**, Piotr Chmielewski***
Jak obserwatorzy postrzegają wertykalizm gotyckiej katedry
wraz ze zmianą jej wysokości? Część III sondażu okulograficznego
How observers perceive the verticality of a gothic cathedral interior
along with the change of its height? Eye tracking survey part III
* ORCID: 0000-0002-5639-5326. Wydział Architektury Poli-
techniki Wrocławskiej / Faculty of Architecture, Wrocław University of
Science and Technology, e-mail: marta.rusnak@pwr.edu.pl
** ORCID: 0000-0002-3026-407X. Centrum Archeologii Śród-
ziemnomorskiej Uniwersytetu Warszawskiego / Polish Centre of Medi-
terranean Archaeology of the University of Warsaw.
*** ORCID: 0000-0002-0290-9969. Instytut Filozoi Uniwer-
sytetu Wrocławskiego / Institute of Philosophy, University of Wrocław.
Introduction
Changes in the proportions of erected sacred buildings
constitute a fascinating issue. It is clearly visible in the
Gothic style. As the style evolved, there were two con-
icting tendencies – to lengthen the layouts of cathedrals
and to make them taller as well as to slim the proportions
of cross-sections of their naves and aisles. It is a clash of
“profound horizontalism” aimed at manifesting the pur-
suit of a place of a mystical transformation of bread and
wine into the body and blood of Christ with verticalism
showing detachment of human thoughts from mundane
matters towards the vault representing the sky. According
to Justyna Spruta, this consistent uplift of Gothic struc-
tures directed the eyes of the faithful upwards, marking
a spiritual path for individual and community prayer [1].
The subject of symbolism hidden in the Gothic church-
es has been discussed by many art historians, architects,
and theologians, including Georges Duby [2], Edward
Norman [3], Roman Walczak [4], Otto von Simson [5],
Wojciech Bałus [6], Alaine Erlande-Brandenburg [7], or
Erwin Panovski [8].
The second part of the 2017 eye-tracking survey de-
scribes visual behaviours connected with perception of
deepening aisles of the 13
th
- and 14
th
-century French
Gothic cathedrals. It turned out that an increase in the
length of these objects served to facilitate concentration of
attention within the presbytery [9]. Thus, a hypothesis of
the existence of the “tunnel church” phenomenon was em-
pirically supported. The aim of the third and last part of the
research was to look at how their perception
was nuenced
102 Marta Rusnak, Joanna Szewczyk, Piotr Chmielewski
W drugiej części przeprowadzonego w 2017 r. son-
dażu okulogracznego opisano zachowania wzrokowe
związane z percepcją pogłębiających się naw XIII- i XIV-
-wiecznych francuskich katedr gotyckich. Okazało się, iż
wzrost długości tych obiektów służył ułatwieniu koncen-
tracji uwagi w obrębie prezbiterium [9]. Tym samym em-
pirycznie poparto hipotezę o istnieniu zjawiska „kościoła
tunelowego”. Celem trzeciej, ostatniej części badań było
przyglądnięcie się temu, jaki wpływ na ich postrzeganie
miała zauważalna w historii architektury tendencja do
wysmuklania proporcji gotyckich wnętrz.
Cel i hipoteza badawcza
Założono, że im smuklejsze staje się wnętrze nawy
głównej katedry, tym więcej uwagi obserwatorzy powinni
intuicyjnie poświęcać elementom znajdującym się w cen-
tralnym pionowym pasie kompozycji. Zgodnie z teolo-
gicznymi założeniami, przytoczonymi we wstępie, wzrok
wiernych powinien szczególnie chętnie koncentrować
się w obrębie sklepienia. Tym samym mniej czasu wier-
ni powinni poświęcać na zapoznawanie się z wyglądem
prezbiterium. Autorzy artykułu założyli jednocześnie, że
wraz ze wzrostem wysokości nawy oczy obserwatorów
powinny wykonywać więcej ruchów, przedzielonych
krótszymi okresami zatrzymań, co odpowiada większemu
dynamizmowi poznawczemu.
Metodologia
Testy przeprowadzono przy użyciu eyetrackerów, ina-
czej okulografów. Są to urządzenia dające możliwość jed-
noczesnej rejestracji oglądanego obrazu wraz z dokładnym
zapisem sposobu patrzenia na prezentowane bodźce, wizu-
alizacje. Okulograf śledzi ruchy gałek ocznych, a specjal-
ne oprogramowanie zbiera dane, co umożliwia późniejsze
wskazanie trasy wodzenia wzrokiem po prezentowanej na
monitorze komputera ilustracji. Poznawcze zachowanie
wzroku można opisać dzięki uproszczonemu podziało-
wi na ich dwa podstawowe stany: ruchy nazywane sak-
kadami i ksacje oznaczające zatrzymanie wzroku [10].
W czasie ksacji możliwe jest świadome postrzeganie
otaczającego nas świata. Takie rozróżnienie pozwala na
dalsze matematyczne opracowanie danych.
W czasie pracy wykorzystano okulograf stacjonarny
RED250HzPortable [11], pozwalający na badanie przy-
gotowanych obrazów (il. 1). Ze względu na liczne różnice
(detal, materiał, wyposażenie) w czasie badania nie wyko-
rzystywano zdjęć istniejących wnętrz, gdyż matematyczne
porównywanie sposobu ich postrzegania byłoby nieosią-
galne. Wizualizacje uproszczonych naw głównych o pro-
porcjach wybranych istniejących gotyckich katedr francu-
skich wydawało się najbardziej odpowiednie. W wyniku
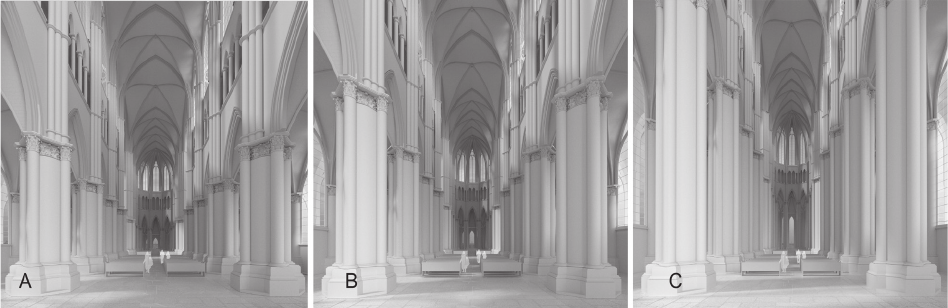
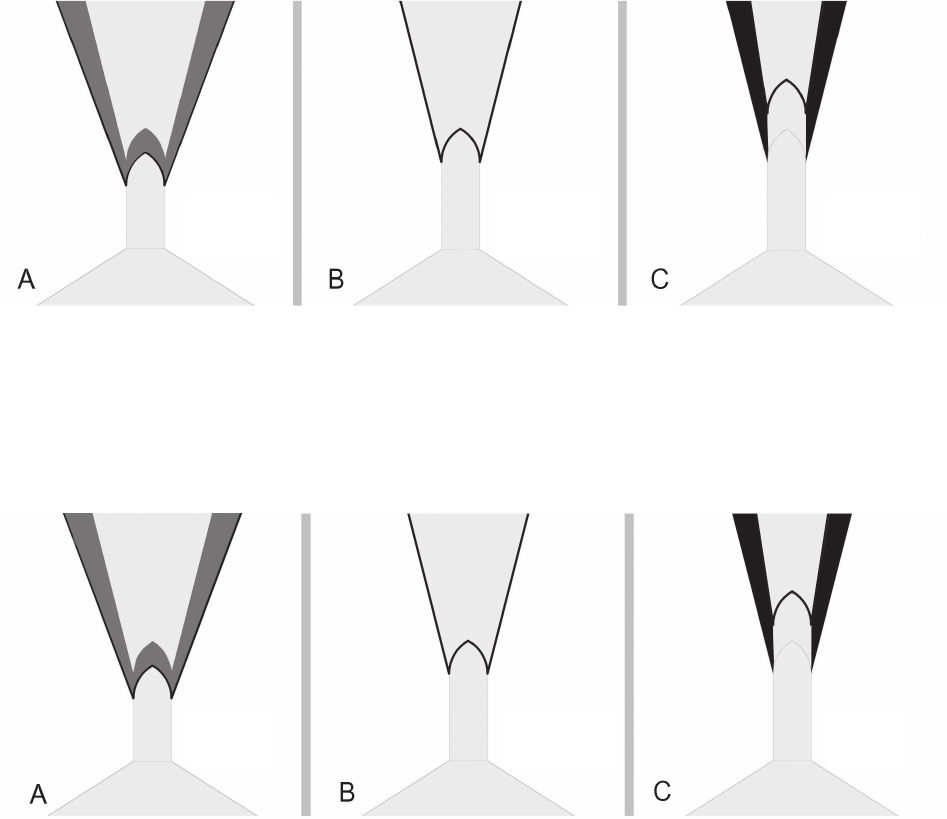
analiz istniejących przykładów za kościół modelowy B,
o uśrednionych proporcjach, przyjęto katedrę w Reims (il.
1B). Przykładem, który posłużył do stworzenia modelu
A o najmniejszej smukłości nawy, była katedra w Chartres
(il. 1A). Proporcje katedry w Bouvais, charakteryzującej
się największą smukłością przekroju nawy, wykorzystano
do wykonania wizualizacji C (il. 1C).
by a tendency to slim proportions of Gothic interiors,
which was noticeable in the history of architecture.
Research goal and hypothesis
It was assumed that the slenderer the interior of the
cathedral nave becomes, the more attention observers
should intuitively pay to the elements situated in the cen-
tral vertical strip of the composition. In accordance with
theological assumptions quoted in the introduction, the
eyes of the faithful should be willingly focused especial-
ly within the area of the vault. Thus, the faithful should
spend less time on getting familiarized with the appear-
ance of the presbytery. At the same time, the authors of
the article also assumed that along with an increase in
the height of the nave, observers’ eyes should make more
movements, separated by shorter periods of detention,
which corresponds to greater cognitive dynamism.
Methodology
The tests were carried out by means of eye trackers.
These are devices that make it possible to simultaneously
register a viewed image along with an accurate record of
the way of looking at the presented stimuli and visual-
izations. The eye tracker tracks (or follows) the move-
ments of eyeballs, and a special software collects data,
which enables a subsequent indication of the route of
guidance with the eyes on the illustration presented on
the computer screen. The cognitive behaviour of eyesight
can be described thanks to a simplied division into the
two basic states, i.e., movements called saccades and x-
ations meaning stopping eyesight [10]. During xation it
is possible to consciously perceive the world surrounding
us. This distinction enables the further mathematical pro-
cessing of the data.
During the research, stationary eye tracker RED250Hz-
Portable [11], which enabled examination of the prepared
images, was applied (Fig. 1). Due to numerous dierenc-
es (detail, material, equipment), no photos of the exist-
ing interiors were used during the examination because
a mathematical comparison of their perception method
would be unattainable. Visualizations of simplied naves
with proportions of the selected existing Gothic French
cathedrals seemed the most appropriate. As a result of the
analyses of the existing examples, the cathedral in Reims
was recognised as model church B with averaged pro-
portions (Fig. 1B). An example which was used to create
model A with the smallest slenderness of the nave was the
Cathedral of Chartres (Fig. 1A). Proportions of the cathe-
dral in Bouvais, which was characterized by the greatest
slenderness of the nave’s cross-section, were used for the
visualization C (Fig. 1C).
The prepared visual stimuli were presented to volun-
teers participating in the research for eight seconds. The
developed procedure made it impossible for one partici-
pant to compare the pictures. The volunteers were adult
residents of Wrocław. The participants declared that they
had no expert knowledge about art, history, conserva-
tion-restoration, or architecture. During the research, the
Jakobserwatorzypostrzegająwertykalizmgotyckiejkatedry / Howobserversperceivetheverticalityofagothiccathedralinterior 103
Il. 1. Wizualizacje naw głównych katedr o różnej wysokości. Wykonano na podstawie proporcji istniejących katedr:
A – Chartres, B – Reims, C – Bouvais (oprac. W. Fikus)
Fig. 1. Visualizations of the naves of cathedrals of different heights were made on the basis of proportions of the existing cathedrals:
A – Chartres, B – Reims, C – Bouvais (elaborated by W. Fikus)
Przygotowane bodźce wizualne prezentowano przez
8 s wolontariuszom biorącym udział w badaniach. Opra-
cowana procedura uniemożliwiała jednemu uczestnikowi
porównywanie ilustracji. Wolontariusze byli pełnoletnimi
mieszkańcami Wrocławia. Uczestnicy deklarowali, że nie
mają eksperckiej wiedzy na temat sztuki, historii, konser-
watorstwa czy architektury. W czasie badania korzystano
z programu Experiment Center [11]. Ostatecznie na pre-
zentowane ilustracje patrzyło 81 pełnoletnich osób. Dwu-
dziestu czterech chętnych widziało ilustrację A, 31 osób
poznało ilustrację B, a 26 wolontariuszy przyglądało się
ostatniej wizualizacji.
Pełny opis metodologii badania zawarto w pierwszym
z serii trzech artykułów [12].
Wyniki
Zebrane w czasie badań dane opracowano w programie
BeGaze SMI [11]. Na potrzeby późniejszych obliczeń na
każdej z wizualizacji wyznaczono pola wizualnego za-
interesowania (areaofintrest– AOI) [13] podzielone na
trzy strefy: sklepienie, prezbiterium i posadzkę połączoną
w jeden zbiór ze stojącymi na niej ławkami i schematycz-
nie zaznaczonymi sylwetkami ludzkimi. Dla wyznaczo-
nych w ten sposób pól program wykonywał osobne ob-
liczenia.
Ogólnaanalizailustracji
Opis konsekwencji zmian proporcji
W wyniku podwyższania nawy głównej kościoła pre-
zbiterium przybiera bardziej wydłużony kształt, a jego
powierzchnia stopniowo wzrasta. Ze względu na takie
samo oddalenie detal prezbiterium ma tę samą wielkość.
Jednocześnie w trakcie takiej transformacji sklepienie
nawy znajdujące się w kadrze kolejnych wizualizacji
unosi się, zajmując coraz mniejszą powierzchnię przygo-
towanego obrazu.
Wraz z podwyższaniem naw kościoła dochodzi do zna-
czących zmian w rozmieszczeniu detalu architektoniczne
go
Expe riment Centre program was applied [11]. Finally,
81 adults looked at the presented illustrations. Twenty-four
volunteers saw picture A, 31 people recognised picture B,
and 26 volunteers looked at the last visualisation.
The full description of the research methodology is in-
cluded in the rst of a series of three articles [12].
Results
The data collected during the research was processed
in BeGaze SMI program [11]. For the purposes of later
calculations, areas of interest AOI were made on each of
the visualisations [13] and divided into three zones, i.e.,
the vault, the presbytery, and the oor connected in one
set with pews standing on it and schematically marked
human gures. The program made separate calculations
for the elds determined in this way.
Generalanalysisoftheillustration
Description of consequences of changes in proportions
As a result of heightening the nave of the church, the
presbytery takes on a more elongated shape, and its area
gradually increases. Due to the same distance, the detail of
the presbytery is of the same size. At the same time, during
such a transformation, the vault of the nave, which appears
in the frame of subsequent visualizations, rises, and occu-
pies an increasingly smaller area of the prepared image.
Along with heightening the nave and aisles of the
church, there appear signicant changes in the arrange-
ment of architectural detail in the eld of view. Example
A (Fig. 1A), which shows the nave with the lowest ele-
vation of the vault, has the greatest intensity of detail. In
the eld of view there are clearly visible as many as four
full vaulted elds and the arcade frieze as well as all the
heads of pillars between the nave and aisles and many
decorative rings on the pillars. Visualization B (Fig. 1B),
representing the “medium tall church” with the propor-
tions of the Cathedral in Reims, does not have so many
details. The visualization of example C (Fig. 1C) includes
104 Marta Rusnak, Joanna Szewczyk, Piotr Chmielewski
w polu widzenia. Przykład A (il. 1A) pokazujący nawę
o najniższym wyniesieniu sklepienia zawiera największe
natężenie detalu. W polu widzenia znajduje się najwięcej,
bo aż cztery pełne pola sklepienne, dobrze zauważalny
jest pas fryzu arkadowego, widoczne są wszystkie głowi-
ce larów międzynawowych i wiele przewiązek służek.
Wizualizacja B (il. 1B), reprezentująca „kościół średnio
wysoki” o proporcjach katedry w Reims, nie ma już tak
wielu szczegółów. Wizualizacja przykładu C (il. 1C)
obejmuje jedynie trzy pełne pola sklepienne, a w górnych
rogach nie widać już części detali. Konsekwencją dalsze-
go podwyższania nawy jest niemal całkowite zniknięcie
detalu z pierwszego planu kadru trzeciej wizualizacji.
Szczególnie zauważalny jest brak głowic. Wraz z pod-
wyższaniem nawy linie zbiegu budowane przez detale
umieszczone w pasach ścian międzynawowych ulegają
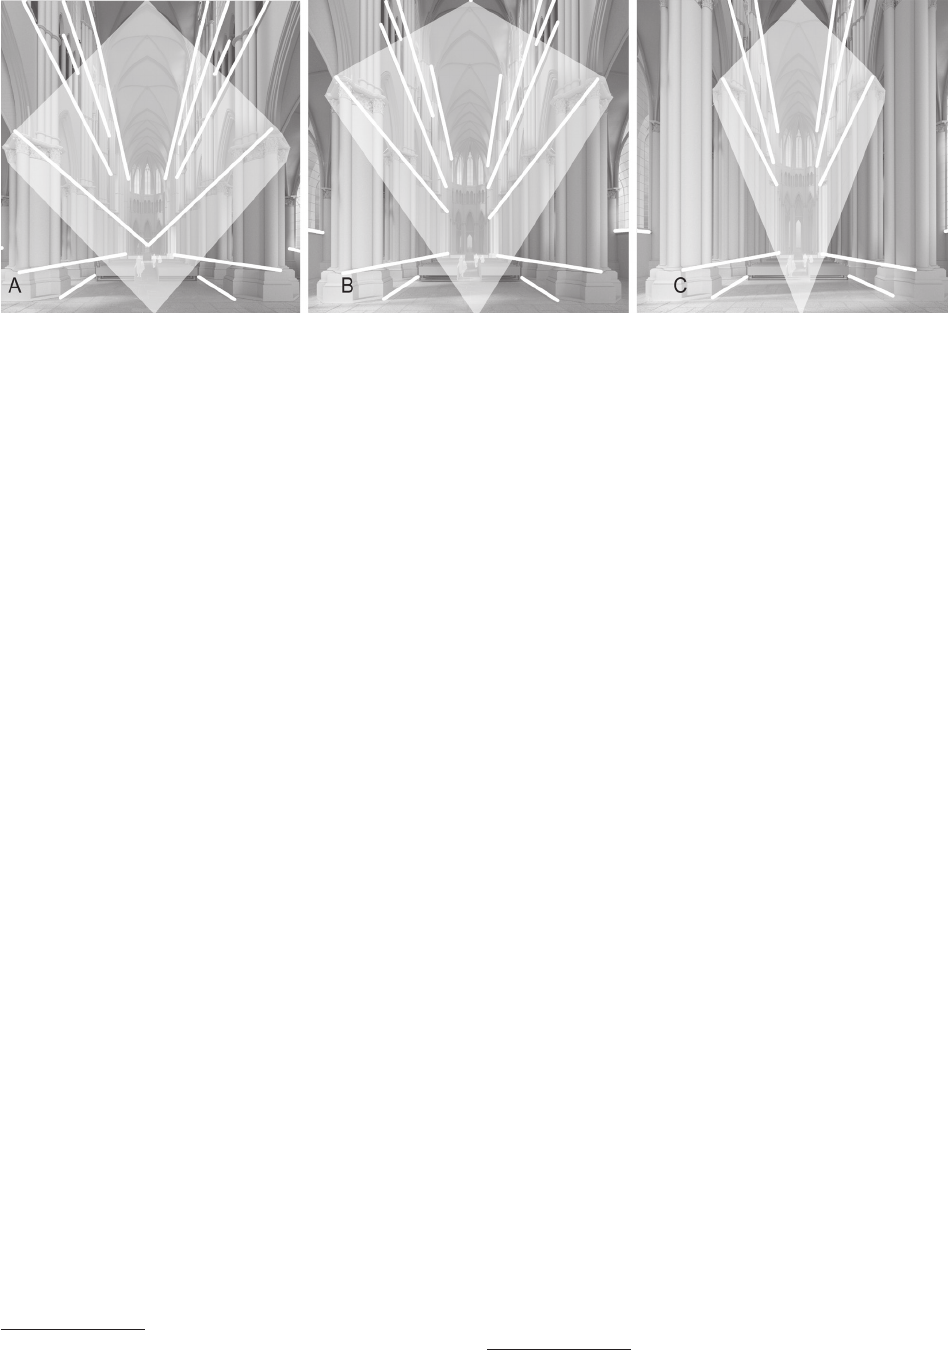
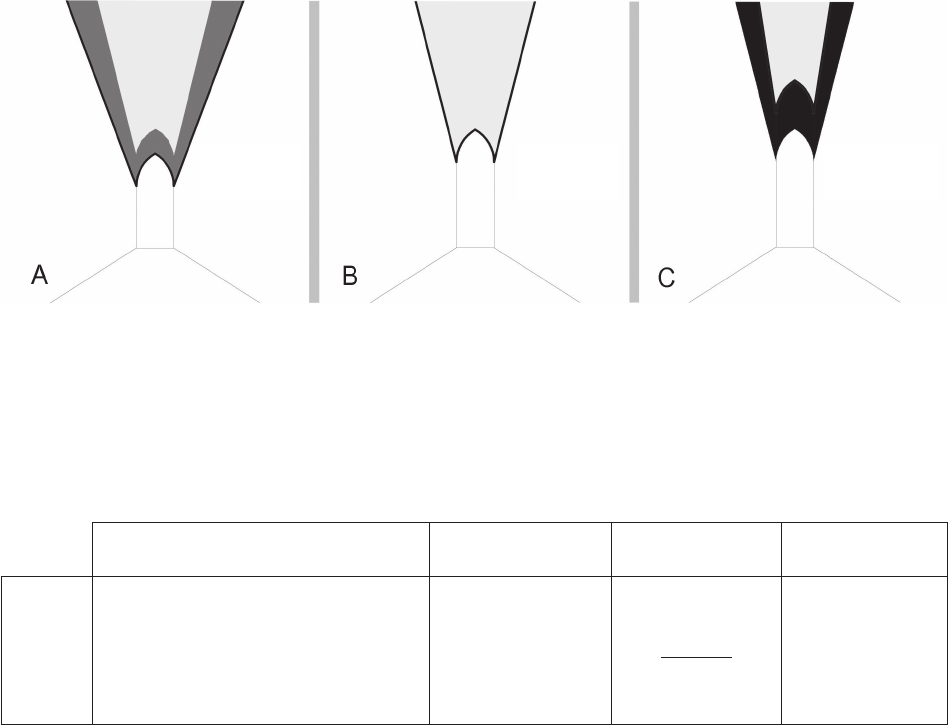
skróceniu i rozsunięciu. Zmianę rozlokowania detalu oraz
linii zbiegów pokazują schematy na ilustracji 2.
Opis uzyskanych map termicznych
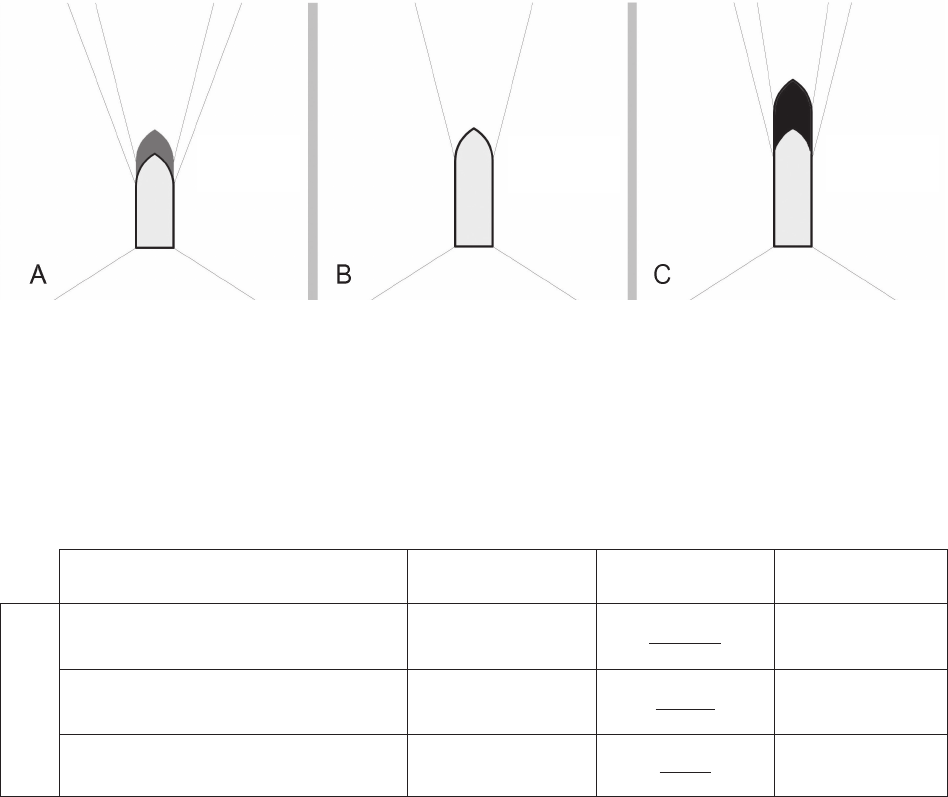
Zawężenie kompozycji zauważalne jest już na etapie
wstępnej analizy zarejestrowanego materiału okulogra-
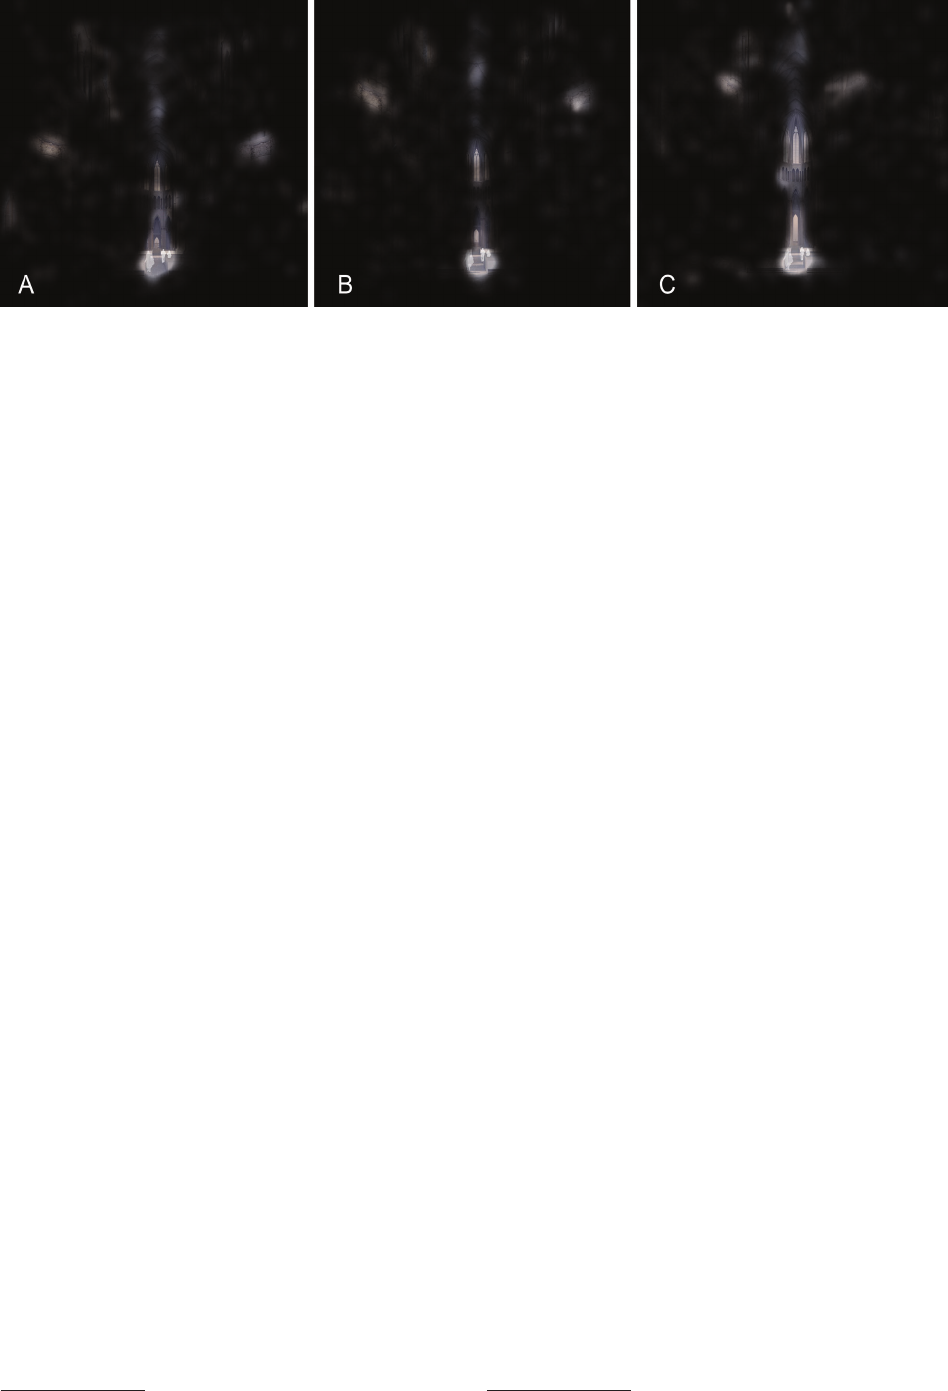
cznego. Przedstawia to ilustracja 3, na której umieszczo-
no odpowiednie dla każdego przykładu mapy zaintereso-
wania wizualnego (focusmaps) [13]. Ilustracje ukazują
wyraźnie miejsca, na które badani patrzyli przez najdłuż-
szy czas. Tak jakby rozświetlali te miejsca, w których
wykonali ksację. Najlepiej widoczne fragmenty były
bardzo często oglądane przez wolontariuszy. Częściowo
prześwitujące spod czerni miejsca były tymi rzadziej oglą-
danymi. Miejsca całkowicie zakryte czernią nie były dla
badanych interesujące. Wygląd map zainteresowania wi-
zualnego pokrywa się ze stwierdzeniem gesztaltystów
1
, iż
wzrok ludzki jest „wykrywaczem nieregularności” [14].
1
W języku niemieckim Gestalt oznacza całość. Polem zaintere-
sowania psychologów nurtu Gestalt była świadomość w trakcie pozna-
wania otoczenia. W latach 20. XX w. członkowie tego nurtu, np. Rudolf
Arnheim, zaczęli aplikować i rozwijać teorie dotyczące zmysłowego
postrzegania sztuki.
only three full vaulted elds, and some of the details are
not visible in the upper corners. The consequence of the
further heightening of the nave is almost complete disap-
pearance of detail from the foreground of the third visual-
ization frame. The lack of heads is particularly noticeable.
Along with heightening the nave, the lines of convergence
which are built by details placed in the strips of walls be-
tween the nave and aisles, are shortened and pulled apart.
The diagrams in Figure 2 show the change of the detail
placement and the converging lines.
Description of the obtained focus maps
The narrowing of the composition is noticeable al-
ready at the preliminary analysis stage of the registered
eye-tracking material. This is illustrated in Figure 3,
where focus maps [13] were placed appropriate for each
example. The illustrations clearly show the places at
which the subjects looked for the longest time. It is as if
they illuminated the places in which they made xation.
The most visible fragments were watched by volunteers
very often. The places partially visible from under the
blackness were those less frequently watched. The places
completely covered with blackness were not interesting
for the respondents. The appearance of focus maps coin-
cides with the Gestaltists’
1
statement that human eyesight
is an “irregularity detector” [14]. For example, the oor,
which was devoid of expressive details, did not intrigue
the viewers. The places of clearances on focus maps
(Fig. 3) coincided with the elds and lines marked in
the composition diagrams shown in Figures 2A–C. This
means that in the last illustration the distances between
successive xation points were shorter. In the last exam-
ple, the eyes of respondents applied a clear coloured axis
on the visualization, in which the basis and the gable of
presbytery are most willingly viewed (Fig. 3C).
1
In German, Gestalt means the whole. The eld of interest of Ge-
stalt psychologists was awareness while getting to know the environ-
ment. In the 1920s, members of this trend, e.g. Rudolf Arnheim, began to
apply and develop theories about the sensual perception of art.
Il. 2. Kompozycja, linie zbiegów perspektywicznych oraz porównanie rozmieszczenia detalu na poszczególnych bodźcach
(oprac. M. Rusnak)
Fig. 2. Composition, lines of perspective convergences and a comparison of the distribution of detail on individual stimuli
(elaborated by M. Rusnak)
Jakobserwatorzypostrzegająwertykalizmgotyckiejkatedry / Howobserversperceivetheverticalityofagothiccathedralinterior 105
Przykładowo, pozbawiona wyrazistych detali posadzka
nie intrygowała widzów. Miejsca występowania prześwi-
tów na mapach zainteresowania wizualnego (il. 3) po-
kryły się z polami i liniami zaznaczonymi na schematach
kompozycji zaprezentowanych na ilustracjach 2A–C.
Oznacza to, że na ostatniej ilustracji odległości pomiędzy
kolejnymi punktami ksacji były krótsze. Na ostatnim
przykładzie oczy badanych osób naniosły na wizualizację
wyraźną oś, w której podstawa i szczyt prezbiterium są
najchętniej oglądane (il. 3C).
Analiza dynamizmu procesu poznawczego
Wnioski z analiz map termicznych znajdują bezpośred-
nie przełożenie na liczbę ksacji wykonanych przez ob-
serwatorów w czasie oglądania poszczególnych bodźców.
Badani w sposób najbardziej spokojny ogarniali wzro-
kiem najniższy układ A, wykonując średnio 24,8 ksacji.
Dwa kolejne przykłady osiągnęły niemal identyczne wy-
niki: 29,2 ksacji przykład B i 29,1 ksacji przykład C.
Porównując te wartości, należy również uwzględnić to,
że ksacje na ostatniej ilustracji wykonywano w obrębie
mniejszego pola, a jego skromniejsze nasycenie detalem
właściwie nie zaowocowało spowolnieniem ruchów ga-
łek ocznych liczonych dla całości obrazu.
Na ilustracji 4 zaprezentowano liczbę ksacji zliczo-
nych jedynie dla centralnych części trzech badanych
bodźców: sklepienia, prezbiterium i posadzki. Prosta
analiza pokazuje, iż pomimo konsekwentnego zmiesza-
nia się pola
2
, dla którego zliczano zatrzymanie wzroku,
liczba ksacji wzrastała od wartości 12,9 (A), poprzez
16,8 (B) do 17,2 (C). Dane jednoznacznie pokazują kon-
sekwentny wzrost czasu spędzonego w trzech rozpa-
trywanych strefach AOI: od 53% (przykład A), 53,4%
(przykład B), do 59% (przykład C), oraz zmniejszenie
czasu przeciętnej ksacji od 321,4 ms (A), przez 275 ms
(B) do 271 ms (C) (il. 5).
2
Wynika to z opisanego wcześniej znikania kolejnych pól skle-
piennych z badanego kadru/pola widzenia.
Analysis of the cognitive process dynamism
Conclusions from the analysis of the thermal maps
are directly reected in the number of xations made by
observers while viewing individual stimuli. The subjects
examined the lowest system A with their eyes in the calm-
est manner, performing on average 24.8 xations. Two
further examples achieved almost identical results, i.e.,
29.2 xations for example B and 29.1 xations for ex-
ample C. When comparing these values, it should also
be taken into account that the xations in the last illustra-
tion were performed within a smaller eld, and its sim-
pler saturation with details did not actually slow down
the movements of the eyeballs, which were counted for
the entire image.
Figure 4 presents the number of xations counted only
for the central parts of the three stimuli studied, i.e. the
vault, the presbytery, and the oor. A simple analysis
shows that despite consistent decreasing of the eld
2
for
which the eye hold was counted, the number of xations
increased from 12.9 (A) through 16.8 (B) up to 17.2 (C).
The data clearly show a consistent increase in time spent
in the three AOI zones under consideration, i.e. from 53%
(example A), 53.4% (example B), to 59% (example C), and
a reduction in the average xation time from 321.4 ms (A),
through 275 ms (B) up to 271 ms (C) (Fig. 5).
DetailedanalysisofindividualfieldsAOI
Attention paid to the vault
Figure 6 shows the inuence of the proportions’ change
of the nave on the appearance of its visualization. The high-
er the cathedral becomes, the smaller part of the vaulted
elds is in the presented frame. Logically, as the surface
area decreased, the participation of people decreased as
well as the time people spent exploring it, i.e., 18.7% (A),
15% (B), 13.8% (C). This is coordinated with the change
2
This results from the previously described disappearance of suc-
cessive vaulted elds from the studied frame/eld of view.
Il. 3. Mapy zainteresowania wizualnego dla poszczególnych wizualizacji (kolejno A, B i C) prezentują jedynie miejsca omiatane wzrokiem
przez uczestników badania (oprac. M. Rusnak / BeGaze)
Fig. 3. Focus maps for each visualization (successively A, B and C) present only those places scanned by the participants of the study
(elaborated by M. Rusnak / BeGaze)
106 Marta Rusnak, Joanna Szewczyk, Piotr Chmielewski
AnalizaszczegółowaposzczególnychpólAOI
Uwaga poświęcana sklepieniu
Ilustracja 6 unaocznia wpływ zmian proporcji nawy
głównej na wygląd jej wizualizacji. Im wyższa staje się
katedra, tym mniejsza część pól sklepiennych znajduje się
w przedstawionym kadrze. Co logiczne, wraz ze spadkiem
pola powierzchni zmniejszył się udział osób, a także czas,
jaki ludzie poświęcają na jego poznawanie: 18,7% (A),
15% (B), 13,8% (C). Jest to skoordynowane ze zmianą
charakteru ruchów w obrębie sklepienia, co ukazuje zesta-
wienie w tabeli 1. Maleje nie tylko liczba ksacji od 5,2
dla przykładu A, poprzez 4,8 dla wizualizacji B, do 4,5 na
sklepieniu ostatniego bodźca, ale także ich długość – od
335,1 ms (A), poprzez 240 ms (B), do wartości 231,5 ms
(C). Oznacza to, iż pomimo spadku
czasu poświęconego
na zapoznanie się ze sklepieniem przeskoki wykonywane
w jego obrębie stawały się bardziej
dynamiczne.
of the character of movements within the vault, which is
presented in Table 1. Not only does the number of xations
decrease from 5.2 for example A, through 4.8 for visualiza-
tion B, up to 4.5 on the vault of the last stimulus, but also
their length – from 335.1 ms (A), through 240 ms (B),
to
a value of 231.5 ms (C), which means that despite the de-
crease in the time devoted to familiarizing with the vault,
the shifts in sight within it became more dynamic.
Attention paid to the presbytery
The next illustration shows the inuence of changes
in the proportions of the nave on the way of visual track-
ing within the presbytery. The slender the proportions
of the nave become, the larger and more fusiform the
presbytery becomes. Along with the surface area increase
(logically), the time people spend on learning about it
should increase. This dependence can be observed for
example C, as it reaches a value of 31.3%. Examples
Il. 4. Schematy przedstawiające liczbę fiksacji w obrębie centralnej części badanych wizualizacji A, B i C.
Oznaczenia dla wykonanych analiz: biały lub jasnoszary – wartość referencyjna, ciemnoszary – wzrost rozpatrywanej wartości,
szary pośredni – pomniejszenie (oprac. M. Rusnak)
Fig. 4. Diagrams showing the number of fixations within the central part of the studied visualizations A, B and C.
Marks for the performed analyses: white or light gray – reference value, dark gray – increase of the considered value, medium gray – reduction
(elaborated by M. Rusnak)
Il. 5. Schematy przedstawiające czas (dwelltime), przez który wzrok obserwatorów znajdował się w obrębie centralnej części
badanych wizualizacji A, B i C (oprac. M. Rusnak)
Fig. 5. Diagrams presenting the dwell time during which the observers’ eyesight was within the central part
of the studied visualizations A, B and C
(elaborated by M. Rusnak)
12,9
ksacji
xations
53% 53,4% 59%
16,8
ksacji
xations
17,2
ksacji
xations
Jakobserwatorzypostrzegająwertykalizmgotyckiejkatedry / Howobserversperceivetheverticalityofagothiccathedralinterior 107
Uwaga poświęcana prezbiterium
Na kolejnej ilustracji przedstawiono wpływ zmian
proporcji nawy głównej na sposób wodzenia wzrokiem
w obrębie prezbiterium. Im smuklejsze stają się proporcje
nawy głównej, tym większe i bardziej wrzecionowate sta-
je się prezbiterium. Wraz ze wzrostem pola powierzchni
(w myśl logiki) wzrostowi powinien ulec czas, jaki ludzie
poświęcali na jego poznawanie. Taką zależność można
zaobserwować dla przykładu C, gdyż osiąga on wartość
aż 31,3%. Przykłady A i B otrzymały niższe, zbliżone do
siebie wyniki 22,5% i 20,4% (il. 7). Wszystkie trzy liczby
nie tworzą rosnącego ciągu liczbowego.
Znacznie bardziej konsekwentne są inne dane cha-
rakteryzujące to pole AOI (tab. 2). Wraz ze wzrostem
smukłości nawy (w myśl logiki) zwiększa się liczba k-
sacji wykonanych w obrębie prezbiterium od 5,5 (A),
poprzez 6,6 (B) do 9,6 (C) zatrzymań wzroku. Konse-
kwentnie skracają się także przeciętne długości ksa-
cji od 301,2 ms (A), poprzez 247,1 ms (B), do wartości
219 ms (C). Niezwykle zaskakujący jest fakt, iż w ze-
branych danych zauważono inny malejący ciąg liczbo-
wy odnoszący się do momentu pierwszego spojrzenia na
strefę prezbiterium. Dla niższego wnętrza badane osoby
po raz pierwszy patrzyły na prezbiterium po 54,7 ms (A).
Uśrednione proporcje wariantu B sprawiły, iż ten sam
A and B got lower results, namely 22.5% and 20.4%
(Fig. 7). All three numbers do not form an increasing
number sequence.
Other data characterizing this AOI field are much
more consistent (Table 2). As the slenderness of the
nave increases (according to logic), the number of xa-
tions made within the presbytery increases from 5.5 (A),
through 6.6 (B) up to 9.6 (C) of eyesight stops. The aver-
age xation lengths are also consistently shortened from
301.2 ms (A), through 247.1 ms (B), up to 219 ms (C). It
is extremely surprising that in the collected data a dier-
ent decreasing sequence of numbers was noticed which
referred to the rst moment of the look at the presbytery
zone. For the lower interior, the subjects looked at the
presbytery for the rst time after 54.7 ms (A). Due to the
averaged proportions of variant B, the same time was
34.1 ms (B). For the last example, this time was surpris-
ingly short and amounted to only 3.4 ms (C). It can be
concluded that the faster the sight nds some element,
the greater its visual potential is [15] and it is more dis-
tinguished from the environment. The numbers in Table 2
show that the presbytery of the highest cathedral is the
most eye-catching. They also mean that despite the de-
crease in the time devoted to getting to know the vault, the
shifts in sight within it became more dynamic.
Il. 6. Schematy przedstawiające czas, jaki badani poświęcili na wzrokowe zapoznanie się ze sklepieniami (dwelltime)
obliczone dla przykładów A, B i C (oprac. M. Rusnak)
Fig. 6. A comparison of the time the respondents devoted to visual cognition of vaults (dwell time) calculated for examples A, B and C
(elaborated by M. Rusnak)
Tabela 1. Charakterystyka procesu zapoznawania się ze strefą sklepień (oprac. M. Rusnak)
Table 1. Characteristics of the process of getting to know the area of vaults (elaborated by M. Rusnak)
Nazwa przykładu
Nameofexample
A. Niska
Low
B. Średnia
Medium
C. Wysoka
High
Strefa AOI
sklepienie
ZoneAOIvault
Liczba fiksacji /średnia długość fiksacji
pierwsza fiksacja
Numberoffixations/averagelengthoffixations
firstfixation
5,2/335,1 ms
4,8/240 ms 4,5/231,5ms
Legenda: podkreślone – wartość referencyjna, kursywa – wartość niższa od referencyjnej, pogrubienie – wartość wyższa od referencyjnej.
Legend:underlined–referencevalue,italics–valuelowerthanreferencevalue,bold–valuehigherthanreferencevalue.
18,7% 15% 13,8%
108 Marta Rusnak, Joanna Szewczyk, Piotr Chmielewski
czas wyniósł 34,1 ms (B). Dla ostatniego przykładu czas
ten był zaskakująco krótki i wynosił jedynie 3,4 ms (C).
Można uznać, że im szybciej wzrok odnajduje jakiś ele-
ment, tym większy ma on wizualny potencjał [15], jest
bardziej wyróżniony względem otoczenia. Umieszczone
w tabeli 2 liczby świadczą o tym, iż prezbiterium naj-
wyższej katedry najsilniej przyciąga wzrok. Oznaczają
one również to, iż pomimo spadku czasu poświęconego
na zapoznanie się ze sklepieniem przeskoki wykonywane
w jego obrębie stawały się bardziej dynamiczne.
Wnioski
Dynamizm ruchów gałek ocznych wzrasta wraz z pod-
wyższaniem nawy głównej przygotowanych wizualizacji.
Wzrost dotyczy zarówno całych powierzchni wizuali-
zacji, jak i wyraźnie preferowanej centralnej strefy pre-
zentowanych wnętrz. Założenie badaczy, iż prezbiterium
wraz ze wzrostem strzelistości układu będzie cieszyć się
coraz mniejszym zainteresowaniem poznawczym, a skle-
pienie większym, nie znalazło potwierdzenia w przepro-
wadzonych badaniach.
Conclusions
The dynamism of eyeball movements increases along
with heightening the nave of the prepared visualizations.
The increase applies both to the entire visualization area
and the clearly preferred central zone of the presented in-
teriors. The researchers’ assumption that the presbytery
will be of increasingly less cognitive interest, and the
vault of greater one, with the increase of slenderness of
the layout, was not conrmed by the research carried out.
Summary of the results
of the entire eye-tracking survey
A comparison of the results of all three analyses, which
formed a series, the rst of which was published in 2018,
was intended to give the overall picture of what Caroline
Humphrey and Piers Vitebsky described as the balancing
between going up and horizontal gravity visible in the
Gothic style. In their opinion, this was supposed to reect
the anxiety of the human soul striving for holiness [16].
According to the results of the entire survey, which was
Il. 7. Schematy przedstawiające czas spędzany w obrębie prezbiterium (dwelltime)
(oprac. M. Rusnak)
Fig. 7. Comparisons of time spent for visual cognition of the presbytery (dwell time) calculated for examples A, B and C
(elaborated by M. Rusnak)
Nazwa przykładu
Nameofexample
A. Niska
Low
B. Średnia
Medium
C. Wysoka
High
Strefa AOI prezbiterium
ZoneAOI
liczba fiksacji / średnia długość fiksacji
Numberoffixations/averagelengthoffixations
5,5/334 ms 6,6/241 ms 9,6/235ms
długość pierwszej fiksacji
lengthofthefirstfixation
301,2 ms
247,1 ms 219ms
czas wejścia
timeofentry
54,7 ms
34,1 ms 3,4ms
Tabela 2. Charakterystyka procesu zapoznawania się ze strefą prezbiterium
(oprac. M. Rusnak)
Table 2. Characteristics of the process of getting to know the zone of the presbytery
(elaborated by M. Rusnak)
Legenda: podkreślone – wartość referencyjna, kursywa – wartość niższa od referencyjnej, pogrubienie – wartość wyższa od referencyjnej.
Legend:underlined–referencevalue,italics–valuelowerthanreferencevalue,bold–valuehigherthanreferencevalue.
22,5%
20,4%
31,3%
Jakobserwatorzypostrzegająwertykalizmgotyckiejkatedry / Howobserversperceivetheverticalityofagothiccathedralinterior 109
Podsumowanie wyników
całego sondażu okulograficznego
Zestawienie wyników wszystkich trzech tworzących
serię analiz, publikowanych od 2018 r., miało ukazać
ogólny obraz tego, co Caroline Humphrey i Piers Vi-
tebsky określili jako widoczne w gotyku balansowanie
między pięciem się w górę a horyzontalnym ciążeniem.
To ich zdaniem miało odzwierciedlać niepokój duszy
ludzkiej zabiegającej o świętość [16]. Zgodnie z wyni-
kami całego sondażu wykonanego przy użyciu okulogra-
fu stacjonarnego [9], [12] można twierdzić, że zarówno
podwyższanie, jak i wydłużanie układu wnętrza gotyckiej
katedry zwiększyło czas, jaki obserwatorzy poświęcali na
patrzenie na strefę prezbiterium. Jednak tylko podwyż-
szenie katedry realnie wzmagało opisany poznawczy
niepokój, znacząco dynamizując proces obserwacji. Wy-
dłużanie nawy powodowało odmienny efekt, uspokajając
wizualne zachowania wchodzących do katedry.
Z powodu braku innych tego typu badań okulogracz-
nych autorzy eksperymentu nie wiedzą, na ile uprosz-
czenie percepcji wnętrza do płaskiego przedstawienia
zmienia podstawowe reakcje wzrokowe. Odnosi się to
zwłaszcza do braku możliwości poruszania głową w celu
popatrzenia na sklepienie lub poznania naw bocznych.
W najbliższej przyszłości przeprowadzone będą również
badania służące werykacji wyników oraz ocenie meto-
dologii badań prezentowanych w omawianej serii trzech
artykułów [9], [12].
Autorzy uznali okulograf za niezwykle interesujące
narzędzie służące poznaniu zjawisk dotyczących zabyt-
ków architektury. Testy nie muszą ograniczać się jednak
wyłącznie do badania ewolucji form i werykacji ist-
niejących teorii funkcjonujących w obiegu naukowym.
W przyszłości okulografy mogą znacząco wspomóc
wszelkie procesy podejmowania decyzji konserwator-
skich, począwszy od zakresu urbanistycznego, poprzez
skalę architektoniczną, na obejmowanych opieką zabyt-
kowych detalach skończywszy. Badania mogą mieć cha-
rakter jednostkowy lub uniwersalny, dotycząc werykacji
ogólnie przyjętych teorii. Najważniejsze wydaje się jed-
nak to, że okulograa jest techniką, dzięki której urba-
niści, historycy sztuki, architekci, archeolodzy czy mu-
zealnicy będą w stanie uzyskać obiektywne numeryczne
wyniki charakteryzujące zjawiska opisywane dotychczas
wyłącznie w sposób subiektywny. Autorzy mają także na-
dzieję, że eyetrackery ułatwią dialog pomiędzy poszcze-
gólnymi grupami eksperckimi i zwiększą skuteczność
w komunikowaniu się profesjonalistów z pozostałą czę-
ścią społeczeństwa.
made with the use of a stationary eye tracker [9], [12], it
can be claimed that both heightening and lengthening the
interior layout of a Gothic cathedral increased the time
observers spent looking at the presbytery zone. However,
only the heightening of the cathedral really increased the
cognitive anxiety described above, signicantly dynamiz-
ing the observation process. Lengthening of the nave had
a dierent eect, i.e. it calmed down the visual behaviour
of those entering the cathedral.
Due to the lack of other eye tracking studies of this
type, the authors of the experiment do not know to what
extent simplifying the perception of the interior to a at
representation changes the basic visual reactions. This
particularly applies to the inability to move the head to
look at the vault or to get to know the aisles. In the nearest
future, research will also be carried out to verify the re-
sults and to evaluate the research methodology presented
in the series of three articles [9], [12].
The authors found the eye tracker an extremely inter-
esting tool for learning about the phenomena related to ar-
chitectural monuments. However, tests do not have to be
limited only to examining the evolution of forms and ver-
ifying existing theories functioning in the scientic cir-
cles. In the future, eye trackers can signicantly support
all conservation-restoration decision-making processes,
ranging from the urban scope, through the architectural
scale, to the historic details that are taken care of. Re-
search may be of an individual or universal character and
concern a verication of the generally accepted theories.
The most important thing, however, is that eye-tracking is
a technique thanks to which urban planners, art historians,
architects, archaeologists and museum professionals will
be able to obtain objective numerical results characteriz-
ing the phenomena described so far only in a subjective
way. The authors also hope that eye-trackers will facilitate
a dialogue between individual expert groups and increase
the eectiveness of communication between profession-
als and other members of the public.
Translatedby
BogusławSetkowicz
Bibliografia /References
[1]
Spruta J., Mistykakatedry gotyckiejArchitekturasakralna jakoobraz
isymbolpostawymodlitewnej, „Studia Gnesnensia” 2014, t. 27, 231–239.
[2] Duby G., Czasykatedr.Sztukaispołeczeństwo980–1420, Państwo-
wy Instytut Wydawniczy, Warszawa 2002.
[3] Norman E., DomBoga.Historia architekturysakralnej, Arkady,
Warszawa 2007.
[4] Walczak R., Symbolikaiwystrójświątynichrześcijańskiej, Wydaw-
nictwo Święty Wojciech, Poznań 2005.
[5] Simson O. von, Katedragotycka.Jejnarodzinyiznaczenie, PWN,
Warszawa 1989.
[6] Bałus W., GotykbezBoga?Wkręguznaczeńsymbolicznycharchitek-
turysakralnejXIXwieku, Wydawnictwo Naukowe UMK, Toruń 2011.
110 Marta Rusnak, Joanna Szewczyk, Piotr Chmielewski
Streszczenie
Artykuł jest ostatnią z trzech części opracowania dotyczącego sondażu okulogracznego przeprowadzanego w 2017 r. w Katedrze Historii Architek-
tury, Sztuki i Techniki na Wydziale Architektury Politechniki Wrocławskiej. Pierwsza omawiała zarejestrowany przez autorów sposób zapoznawania
się z głębią nawy głównej kościoła gotyckiego. W drugim etapie omówiono zjawisko tzw. kościoła tunelowego. Podobnie jak w poprzednich artyku-
łach, także w tej części na potrzeby eksperymentu wykorzystano wizualizacje XIII- i XIV-wiecznych katedr francuskich. Badaczy interesowało to,
na ile smukłość nawy głównej gotyckiej katedry przekłada się na percepcję całego zmieniającego się układu wnętrza.
Słowa kluczowe: okulograa/eye tracking, katedra gotycka, percepcja architektury, wertykalizm
Abstract
This paper constitutes last part of a three-part report considering an eyetracking survey that took place in 2017 at the Department of History of Ar-
chitecture, Art and Technique at the Wrocław University of Science and Technology. The rst part of the report discussed the way people perceive
the depth of the nave of agothic church. The second stage of research discused the phenomenon of so called “tunnel church”. This part of the study,
the same as previous ones, made use of visualizations of 13
th
and 14
th
century French cathedrals. The researchers were interested in how much the
slenderness of the nave of the Gothic cathedral translates into the perception of the entire cevolving interior.
Key words: eye tracking, gothic cathedral, perception of architecture, vertical
[7] Erlande-Brandenburg A., Mérel-Brandenburg A.B., Histoire
de l’architectureFrançaise.DumoyenAge à la Reinaissance:
IV
e
sicle–dbutXVI
e
sicle, Caisse nationale des monuments hi-
storiques et des sites, Mengès, Paris 1995.
[8] Panofsky E., Architecturegothiqueetpensescolastiqueprcd
deL’abbSugerdeSaint-Denis, Les Edition de Minuit, Alençon
1992.
[9] Rusnak M., Chmielewski P., Szewczyk J., Zmianywpostrzeganiu
prezbiteriumprzyróżnejdługościnawy.Kościółtunelowywba-
daniachokulogracznych / Changesintheperceptionofapresby-
terywithadierentnavelength. Funnelchurchin eyetracking
research, „Architectus” 2019, nr 2(58), 73–83, doi: 10.5277/
arc190206.
[10] Holmqvist K., Nystöm M., Anderson R., Dewhurst R., Jarodz-
ka H., van de Weije J., Eyetracking.Acomprehensiveguidetome-
thodsandmeasures, Oxford University Press, Oxford 2011.
[11] https://www.smivision.com/ [accessed: 1.06.2017].
[12] Rusnak M., Fikus W., Szewczyk J., Jakobserwatorzypostrzegają
głębięwewnętrzugotyckiejkatedrywrazzezmianąjejpropor-
cji?Sondażokulograczny / Howobserversperceivethedepthof
agothiccathedralinterioralongwiththechangeofitspropor-
tions?Eyetrackingreaserch, „Architectus” 2018, nr 1(53), 77–88,
doi: 10.5277/arc180105.
[13] Duchowski A.T., Eyetrackingmethodology.Theoryandpractice,
Springer-Verlag, London 2007.
[14] Gombrich E., Zmysłporządku.Opsychologiisztukidekoratywnej,
Universitas, Kraków 2009.
[15] Kirenko J., Wawer R., Dystansversustolerancja.Percepcjanie-
pełnosprawnościwbadaniacheyetrackingowych, Wydawnictwo
UMCS, Lublin 2015.
[16] Humphrey C., Vitebsky P., Architekturaisacrum, Świat Książki,
Warszawa 2005.
Podziękowania
Serdecznie dziękujemy Wojciechowi Fikusowi za wykonanie użytych
w czasie eksperymentu wizualizacji.Podziękowania kierujemy rów-
nieżpodadresemprof.drhab.inż.arch.MałgorzatyChorowskiejoraz
drinż.arch.AleksandryMarcinów.Asystąinieocenionymwsparciem
technicznympodczastestówsłużyłanammgrinż.EwaRamus–repre-
zentującarmęNeuroDeviceGroup.Ponowniedziękujemydrinż.arch.
AgnieszceGryglewskiejiprowadzonemuprzezniąKołuNaukowemu
ArcHist.
Acknowledgement
WewouldliketothankWojciechFikusformakingvisualizations used
duringtheexperiment.Wealsoextendourthankstoprof.drhab.eng.
arch.MałgorzataChorowskaandAleksandraMarcinów.Theassistan-
ceandinvaluabletechnicalsupportduringthetestswasprovidedby
mgrinż.EwaRamus–representingthecompanyNeuroDeviceGroup.
OurthanksagaintoDr.Eng.AgnieszkaGryglewskaandtheArcHist
ScienceClubsheruns.